How to Simulate an RC Low-Pass Filter in LTspice and Analyze Frequency Response
2024-10-30 | By Maker.io Staff
Simulating and analyzing the frequency response of an RC low-pass filter is essential for understanding how this fundamental circuit behaves under varying signal conditions. The RC low-pass filter allows low-frequency signals to pass through while attenuating higher frequencies. The simplicity and effectiveness of the filter make it a very popular circuit in a plethora of applications where noise reduction and signal integrity are needed.
This article provides a practical guide to simulating an RC low-pass filter using LTspice. LTspice allows engineers to model circuits and visualize their performance without the need for physical prototypes. This will walk you through the steps to create a basic RC low-pass filter circuit, configure the simulation parameters, and analyze the resulting frequency response.
By the end of this article, you will have a clear understanding of how to use LTspice to simulate the behavior of an RC low-pass filter, with a focus on fundamental aspects like cutoff frequency, magnitude response, and phase shift.
Running the Simulation
1. Create a New Schematic
- Open LTspice and create a new schematic by selecting File > New Schematic.
 Figure 1: Selecting a new schematic.
2. Place Components
- Add the resistor (R) and capacitor (C) components to the schematic.
- You can place components by selecting the resistor and capacitor symbols from the toolbar.
- Connect the resistor and capacitor in series using the wire selection from the toolbar. Place the resistor first, followed by the capacitor.
 Figure 2: The location of the resistor, capacitor, and wire components.
3. Assign Values to Components
- Right-click on the resistor to set its value (e.g., 1kΩ).
- Right-click on the capacitor to set its value (e.g., 1µF).
4. Add the AC Voltage Source
- Press F2, search for "Voltage", and place a voltage source at the input of the RC circuit.
- Right-click the voltage source, select, “Advanced” and set its AC amplitude to 1V, and leave other settings as default.
5. Define the Ground Node
- Every LTspice simulation requires a ground node. Press G to place a ground symbol and connect it to the circuit at the negative terminal of the voltage source, as well as the unconnected terminal of the capacitor.
 Figure 3: A complete RC lowpass filter circuit.
6. Set Up the Simulation
- Go to Simulate > Edit Simulation Cmd.
- Select the AC Analysis tab.
- Set the type of sweep to Octave or Decade, choose the number of points per octave/decade (e.g., 100), and specify the frequency range (e.g., 10Hz to 1MHz).
- Place the simulation command on the schematic.
 Figure 4: Setting up the AC analysis.
7. Run the Simulation
- Click the Run button or press the Run icon.
- After the simulation runs, a graph window will pop up.
Analyzing the Frequency Response
1. Plot the Output
- In the graph window, click the output node to plot the voltage across the capacitor.
- LTspice will display the magnitude and phase of the output voltage as a function of frequency.
 Figure 5: The graph is plotted by clicking on the output node as shown.
2. Interpret the Results
- Magnitude Response (Solid Green Line):
- The magnitude plot shows how the output voltage decreases with increasing frequency.
- At low frequencies, the output voltage is near the input voltage, indicating that low frequencies pass through with minimal attenuation.
- As the frequency increases, the output voltage drops following a -20dB/decade slope after the cutoff frequency.
- Phase Response (Dashed Green Line):
- The phase plot will show how the phase of the output signal lags the input signal, shifting towards -90° as the frequency increases.
3. Determine the Cutoff Frequency
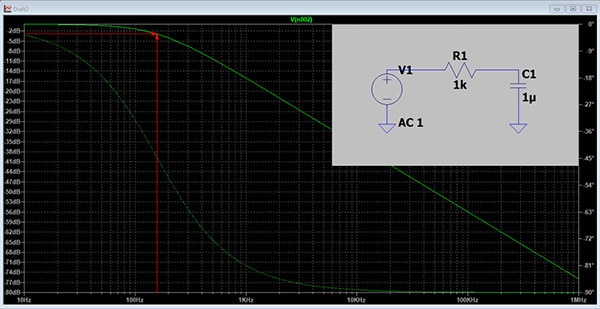
- The cutoff frequency fc occurs where the output voltage magnitude falls to 70.7% (or -3dB) of the input. In our example, this magnitude is 0.707V.
- For a simple RC circuit, the cutoff frequency can be calculated as
 . In our example, the expected cutoff frequency is
  160Hz
160Hz
4. Evaluate Performance
- Compare the simulated cutoff frequency with the theoretical value. Verify this by observing where the magnitude plot crosses -3dB.
- To better visualize, right-click on the y-axis and change the Range “Tick” field to 1dB. Then, enlarge the size of the graph by dragging the bottom border down.
- Optionally, enable grid marks by selecting Plot Settings > Grid.
- Analyze how component values (R and C) affect the filter’s performance and experiment with different values to see how they shift the cutoff frequency.
 Figure 6: By extending the bode plot, the cutoff frequency can be seen to match the theoretical value.
Conclusion
Simulating an RC low-pass filter in LTspice and analyzing its frequency response provides a clear understanding of how the filter attenuates high-frequency signals while allowing low-frequency signals to pass through. By following these steps, you can visualize the behavior of the filter and make informed design choices based on the frequency response. Additionally, you can check out DigiKey’s Low Pass/High Pass Filter Calculator for help designing filters for your next project.
Recommended Reading
The Basics of Anti-Aliasing Low-Pass Filters (and Why They Need to be Matched to the ADC)


 . In our example, the expected cutoff frequency is
  160Hz
160Hz