制造商零件编号 2190E
100MHZ DIG STORAGE OSCILLOSCOPE
B&K Precision
A multimeter is the perfect tool for quick troubleshooting and getting a first idea of a circuit's behavior. However, many problems require measuring and visualizing how signals change over time — a job for oscilloscopes.
While using an oscilloscope might initially seem daunting, this article demonstrates how you can perform your first measurement in little to no time.
An oscilloscope, or o-scope in short, is a tool that can measure an electrical signal as it changes over time and represent the result as a graph. Typically, the output plots the signal along the y-axis and the time along the x-axis.
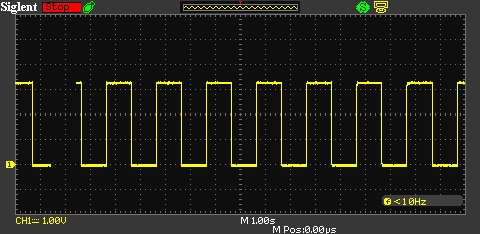 This screenshot shows the main parts of the o-scope display.
The device plots the signal from left to right over time and depicts the amplitude along the y-axis. The top-left corner shows the current run mode, and the bottom-left corner shows the amplitude step size.
You should use an o-scope to determine a signal's frequency, shape, or amplitude. These tools are also perfect for comparing multiple signals and inspecting how they change over time. Using an oscilloscope can answer questions such as:
While all scopes vary in their exact features and how users access them, most devices follow a similar button layout:
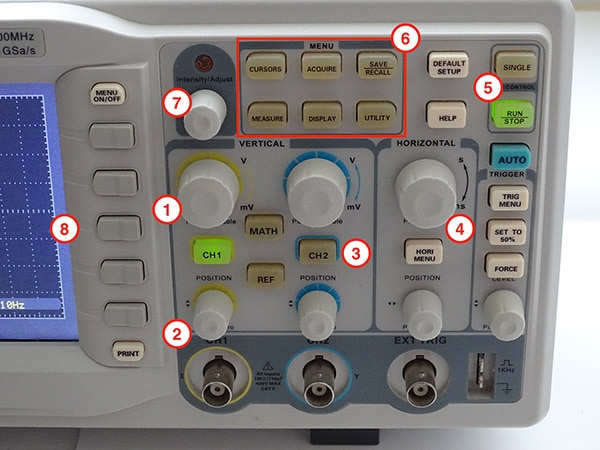 This image shows a typical oscilloscope button layout.
Users can typically adjust the scale of both axes to zoom in and out using rotary knobs(1). Adjusting the x-axis (4) determines the time frame captured by the scope. Changing the reference points (2) moves the curves up and down on the display. Most scopes also offer automatic adjustment, working reasonably well in many cases and helping you find the correct settings.
More sophisticated o-scopes can simultaneously measure two or more signals (3) to let users compare waveforms and uncover more elaborate problems, such as timing issues. The hold button (5) freezes the display to enable closer investigation of the graph. Usually, more complex functions, such as measurements (6) and math features, require using an on-screen menu. Depending on the device, the input can happen via a touch screen, buttons (8), or dials (7) next to the display.
When performing your first measurement, you should locate the first channel's probe connection on the scope and plug in the probe. Once plugged in, the connector usually needs to be secured by twisting.
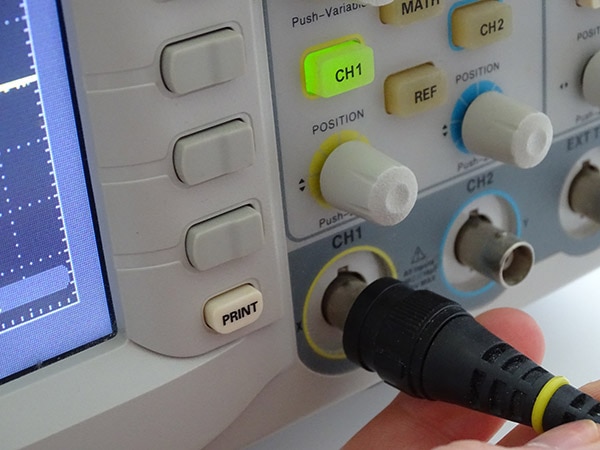 Plug the probe into the first channel's socket and twist it a quarter of a turn clockwise to fasten the connector.
Next, connect the probe to the pin to measure and the probe's reference clamp to the reference point to use, which will usually be GND.
 This image shows how to connect the probe to the pin to measure.
The reference clamp is connected to GND via the ethernet port’s metal body.
You may want to connect the probes while all devices are powered off to prevent short circuits. Once done, it's time to turn on the scope and the device. You should try using the scope's automatic mode to save some time setting up the correct voltage and time ranges. The o-scope should display something similar to this once it finds suitable settings:
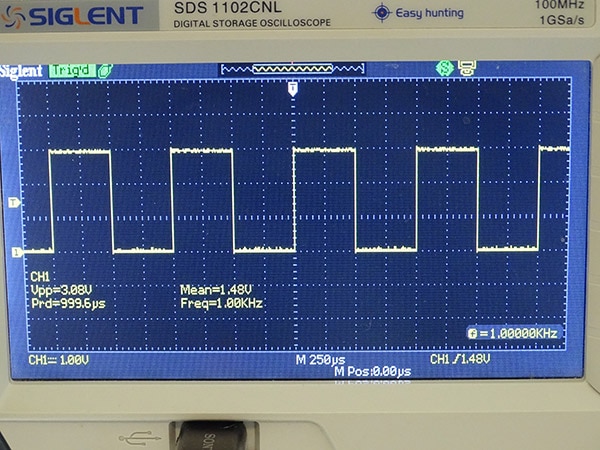 This image shows a typical output generated by an o-scope when measuring a 1kHz square wave on channel one.
This device draws the waveform of channel one in yellow, and it also summarizes the automatically detected properties of the signal, such as the peak voltage, the mean voltage, the period, and the frequency. The bottom-left corner shows the voltage scale, which is 1.00V in this example. The voltage range corresponds to the on-screen grid's height, meaning that each grid cell represents a 1.00V change along the y-axis. Similarly, the number in the center indicates that each grid cell represents a time of 250 microseconds along the x-axis.
Sometimes, the on-screen grid doesn't offer enough accuracy to determine the signal's voltage or timing. In the previous example, the voltage was very close to 3.0V, which aligns very well with the grid. However, some cases, such as 3.3V, may require on-screen cursors, which offer more precise measurements without changing the scaling. This feature can usually be accessed by a button that lights up once activated:
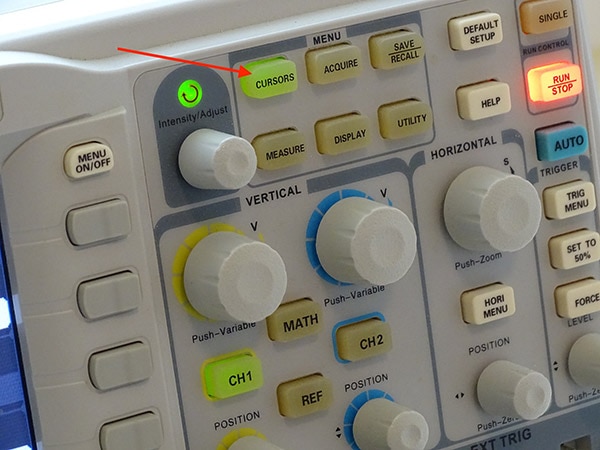 The cursors button lets users place reference points on the screen.
The o-scope can use these references to calculate frequencies and timings.
On this particular o-scope, the cursor menu appears on the display:
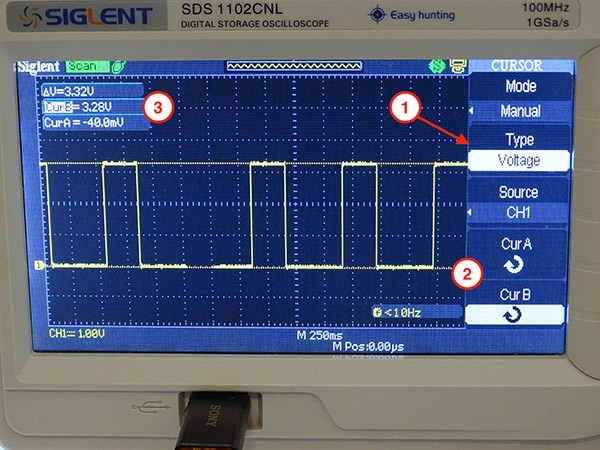 This image shows the cursors menu and the calculation results.
You can usually change the cursor type (1) to perform voltage or timing-related calculations. Multi-channel oscilloscopes typically also support cursors for all channels. Once you select a channel, you can move both cursors along the chosen axis (2). The scope then calculates several values depending on the cursor type (3). In the first example, the device displays the cursor positions and the voltage difference between the cursors. The second one shows the time difference between the signal's falling and the next rising edge.
 This example demonstrates time-cursors that can help identify timing-related issues in circuits.
Finally, if you are more experienced, more advanced oscilloscopes offer multiple other measurement options, such as signal rise and fall times, to help you troubleshoot circuits. However, it's best to refer to the device's user guide for further details, as the supported functions vary significantly between devices.
 This image shows more values the o-scope can measure without additional user input.
An oscilloscope is a tool that measures electrical signals as they change over time and represents the result as a graph. It is perfect for determining a signal's frequency, shape, or amplitude. The display shows the signal plotted from left to right over time and amplitude along the y-axis. A typical oscilloscope lets you adjust the scale of both axes and move the reference point. You can push the hold button to freeze the display to investigate the graph more closely.
 You can also get oscilloscope DIY kits without spending too much.
For your first measurement, you must connect the probe to the scope and then to the pin to measure. You should use the scope's automatic mode to find suitable settings. Finally, you should rely on the device's built-in calculation capabilities for increased accuracy.