How To Evaluate Machine Learning Model Performance?
2023-09-13 | By Maker.io Staff
Evaluating model performance and comparing the results between models and preprocessing techniques is no less important than collecting data and building models when designing machine learning (ML) applications. This article introduces the basics of ML model evaluation so that you can compare outcomes to build the best possible model for the existing data.

Choosing the Correct Metric for Evaluation Machine Learning Models
You can typically break down all ML tasks, such as prediction or clustering, into either a classification or regression problem, then train a model for that task using training data. When evaluating model performance, choosing a metric suitable for the implemented task is crucial, as the wrong metric might skew or misrepresent the results.
Accuracy, recall, precision, sensitivity, and specificity are often-used metrics for assessing classification model performance. To calculate these values, you train a model using the training data before testing it with the test set, during which they collect the number of correctly and falsely classified samples. You can repeat this process for different models, parameter settings, and preprocessing measures to compare them later.
In contrast, regression tasks typically call for numeric methods — the mean-squared error, for example. These metrics give you a single numeric value that quantifies how far the model deviates from the true value.
Finally, clustering and other special tasks can benefit from additional metrics such as similarity measures. These measures are sometimes called distance-based metrics, as they describe how far away the classified samples are from the true mean in a distribution.
Understanding Classification Metrics
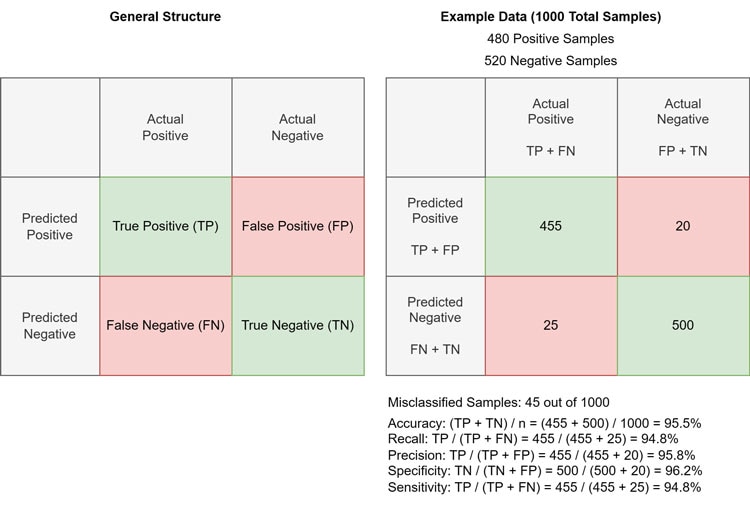
After testing a model using the test set, you will end up with four numbers that capture how well the model can predict labels in the test set. These are true positive (TP), true negative (TN), false positive (FP), and false negative (FN). As the names suggest, the TP describes all positive samples in the test set correctly classified as positive samples, the FN number encodes how often the model falsely labeled a positive sample as negative, and so on. You can visualize these numbers in the so-called confusion matrix:

This image shows the general structure of a confusion matrix and an example with concrete values.
The ideal model should only contain non-null entries in the TP and TN cells. However, such a result indicates the model’s tendency to overfit. The example above shows more realistic values and outlines how to calculate the various metrics relevant to classification tasks.
Accuracy is a general metric that measures the overall correctness of the model’s predictions. It calculates the sum of correctly classified samples and divides it by the total number of instances. Recall (also called sensitivity) measures the model’s ability to correctly identify positive instances, and precision measures how many of the total positive instances in the test data the model correctly predicted as positive. Conversely, the specificity measures the model’s ability to correctly predict negative instances.
Note that recall (i.e., sensitivity) and specificity are complementary metrics, meaning that as one increases, the other decreases and vice versa. Similarly, precision and recall tend to have an inverse relationship. Whether developers should focus on increasing sensitivity or specificity depends on the specific application. Some use cases, such as cancer screening, should have a low false negative rate to avoid missing sick patients, while fraud detection generally benefits from an optimized true positive rate.
Understanding Metrics for Evaluating Regression Tasks
While comparing ratios between correctly and incorrectly classified samples works well in classification tasks, regression calls for different means when evaluating a model’s performance. Most evaluation metrics for regression tasks capture the overall numeric deviation of the model’s predictions during the test phase and compare that number to the actual value. There are various formulae you can use to quantify the discrepancy. However, the mean squared error (MSE) and the sum of squared errors (SSE) are among the most commonly used choices.
For the upcoming examples, consider the following table that lists the true values and the ML model’s predictions:

This table shows some exemplary model prediction results vs. the expected values.
Beneath the table are the formulae for MSE and SSE. Note that the SSE represents the total sum of squared errors across all data points:

The MSE includes the SSE and averages it across all data points in the test set by dividing the SSE by the number of samples. Therefore, the MSE is a normalized version of the SSE:

This normalization allows the MSE to give an average error value independent of the dataset size, making it a more suitable metric for comparing model performance across widely varying data sets. In the above example, the total squared error is eleven, and the average error per data point is 1.83.
Summary
Machine Learning evaluation metrics are necessary for assessing model performance and ensuring comparability of results between models, data sets, and preprocessing techniques. It’s important for you to choose an appropriate evaluation metric for your ML task.
Classification problems often use metrics that count how many mistakes a model makes while predicting labels. Standard classification metrics include accuracy, precision, specificity, and sensitivity. Depending on the application, you can use these metrics to choose a model that fits your use case or tweak an algorithm's parameters to optimize the learning process. A confusion matrix can help visualize the model's TP, FP, TN, and FN rates.
Numeric evaluation metrics are suitable for assessing a model's performance when dealing with regression tasks. These metrics quantify the deviation of the model's predictions from the expected values and output a single number. MSE and SSE are two metrics commonly used, and since MSE is a normalized version of SSE, comparing model performance across different data sets becomes easier.
Have questions or comments? Continue the conversation on TechForum, DigiKey's online community and technical resource.


