How the CIE Color Space is Used to Design Better LEDs
投稿人:电子产品
2015-06-02
Most lighting engineers working with LEDs understand how the Commission Internationale de l'Eclairage (CIE) 1931 x, y color space (or CIE color space) is used as the basis for characterizing white LEDs. The output from pure-color or white LEDs can be defined in terms of color (hue) and saturation (purity) by x and y coordinates on the diagram.
However, few engineers understand why the CIE color space works so well as an analytical tool for LEDs. Part of the reason is that natural daylight is used as a benchmark for LED output. This is because the Sun is considered the perfect illuminator (to which our eyes have become perfectly evolved) being a black body radiator that emits light across a wide range of bandwidths. Unique among lighting technologies, pure-color LEDs allied with wavelength-shifting phosphors are a near-ideal artificial light source because they are able to closely mimic the Sun’s Spectral Power Distribution (SPD) while limiting energy emission to the visible spectrum.
The output from black body radiators can be plotted on the form of a locus on the CIE color space that serves as the reference for LEDs’ Color Correlated Temperature (CCT). CCT is an important parameter for characterizing LEDs and allows manufacturers to offer a range of white light devices to suit many applications.
This article looks at the origins of the CIE color space––an idea dreamed up long before LEDs were practical for mainstream lighting––and explains how it is used to aid the development and characterization of modern LEDs.
Nature’s black body radiator
Before humans discovered artificial light the only source of illumination was the Sun. Millions of years of evolution has resulted in eyes that are optimized for operation in sunlight and humans naturally associate such light with comfort and safety.
The Sun is (approximately) a black body radiator emitting light as a result of thermal processes. Light is defined as electromagnetic radiation visible to the eye. In the Sun, the primary source of this electromagnetic radiation is from atoms excited by the thermal energy of fusion in the star’s core.
Such excitation is highly random, but on a macroscopic scale, light emission from a black body can be modeled accurately using Planck’s Law. The law describes the electromagnetic radiation emitted by a black body in thermal equilibrium at a definite temperature. The energy emitted at a given wavelength (which includes those in the non-visible spectrum such as infrared and ultraviolet) changes for black bodies of different temperatures; for example, at lower temperatures longer (redder) wavelengths dominate and the black body glows a dull red. Warmer black bodies emit more energy at shorter (bluer) wavelengths and range in color from bright yellow to bluish-white as they get hotter.
The plot of the SPD of a black body illustrates the concentration, as a function of wavelength, of a radiometric or photometric quantity such as radiant energy or radiant flux from the light source. The temperature at the Sun’s surface is about 5250 K and it emits the characteristic yellow-white color of a mid-temperature star with peak emissions (perhaps not surprisingly considering how the Sun has influenced the evolution of the eye) in the visible part of the spectrum. Figure 1 shows SPDs of various black bodies––including an analog of the Sun emitting at 5000 K––overlaid on the visible part of the electromagnetic spectrum.
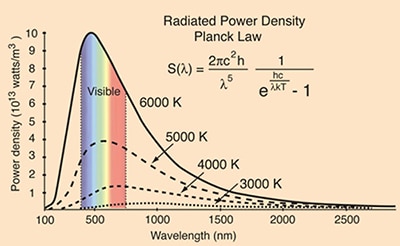
Figure 1: Spectral Power Distribution of black body radiators at selected temperatures.
(Note that the atmosphere, which in particular scatters blue light, alters the Sun’s color at the Earth’s surface. When the Sun is overhead its light travels through less atmosphere so appears more “natural” (i.e. yellow-white) whereas in the evenings, for example, the light travels through a thicker layer of atmosphere and hence appears redder as the blue wavelengths are scattered to a greater degree.)
The CIE color space
The CIE color space was derived from a series of experiments done in the late 1920s by William David Wright and John Guild. The diagram provided the first defined quantitative links between physical pure colors in the visible electromagnetic spectrum and physiological perceived colors in human color vision.
The eye does not detect all colors equally. For example, the color-sensing cones in the retina are most sensitive to green light. The sensitivity of these special cells tails off rapidly towards the blue (and red) part of the spectrum. The cones’ sensitivity to blue light at 472 nm, for example, is just 10 percent of that to 555 nm green.
What’s particularly novel about the CIE color space is that it uses a set of color-matching functions that are a numerical description of the chromatic response of a “standard” human observer. The color-matching functions associate physically produced light spectra with specific tristimulus values – thus taking into account the varying sensitivity of the eye’s light receptors.
The CIE color space allows the chromaticity (an indication of the quality of a color, independent of luminescence) of a color to be plotted using two derived parameters, x and y. Not all values of x and y in the color space correspond to a visible color. Rather, all the visible colors are contained within an envelope defined by the “spectrum locus” and the “purple line.” The spectrum locus is a curve that plots the x, y values for colors comprising a single wavelength across the whole visible spectrum. The numbers on the locus correspond to the wavelength of the color. The purple line – a straight locus made up of mixes of reds and blues – forms the lower boundary of the CIE color space (Figure 2).
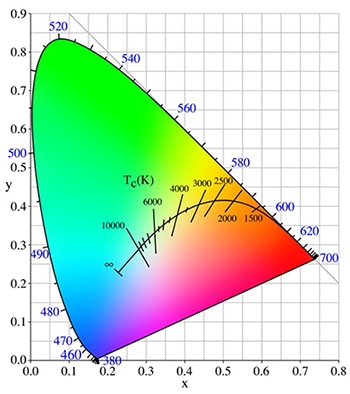
Figure 2: CIE color space showing location of Planckian locus.
A color’s hue is determined by its basic color on the spectrum (for example, red, orange, yellow, green, blue, or violet). The saturation of a color comprising one or few wavelengths is always greater than light of the same hue but with a wider spectral bandwidth. The greater the spectral bandwidth (decreasing saturation) the further the x, y chromaticity coordinates move from the spectrum locus. In the central region of the diagram colors are de-saturated and exhibit a pastel hue. Move far enough into the center of the diagram and colors become off-white and white. White is often described as an absence of color and is comprised of many wavelengths. The closest point to “pure” white in the CIE color space is the point that equates to an SPD exhibiting equal energy at every wavelength in the visible spectrum. This point is sometimes labeled “E” on the CIE color space but is of minimal interest to LED makers because the technology does not easily lend itself to the manufacture of equal energy light sources.
Another key feature that is typically included on the CIE color space is the Planckian (or black body) locus. These are a plot of the chromaticity coordinates of black bodies of various temperatures from 1000 K (deep red) to 10,000 K and above (bluish-white), see Figure 2 above.
Characterizing LEDs
Before they were considered for lighting applications, LEDs became popular for applications such as indicators and signage. Red, green, and blue devices continue to be manufactured in their billions and the LED makers joined other lighting manufacturers in using the CIE color space to characterize their products.
Hue (determined by the dominant wavelength of the LED) and saturation can be explicitly defined using the diagram. The hue of an LED is defined as the wavelength on the spectrum locus intersected by a line from the equal energy point (E) through the x, y coordinates of the LED. The saturation is determined by the position of the LED’s x, y coordinates along this line. If the x, y coordinates are coincident with E the purity is 0. As the coordinates of the LED move along a line toward the spectrum locus purity increases, reaching 1 at the locus (Figure 3).
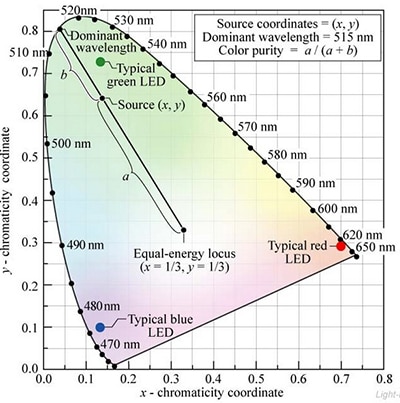
Figure 3: The CIE color space can be used to explicitly define the hue and saturation of LEDs and other light sources. (Courtesy of Cambridge University Press)[1]
So much for pure color LEDs, here we are concerned with white devices for lighting applications. The CIE color space can be used to indicate the range (or “gamut”) of colors that a combination red, green, and blue (RGB) LEDs can produce. Careful mixing of the light is one way to produce “white” LEDs. The range of possible x and y coordinates of the RGB combination will fall within a triangle whose vertices are the x, y coordinates of the three sources (see the TechZone article “A Third Approach for White LEDs”).
However, the majority of today’s commercial white LEDs for lighting applications combine a royal blue LED with yttrium-aluminum-garnet (YAG) phosphor. Most of the LED’s photons are absorbed by the phosphor and, by a process known as Stokes shifting, are re-emitted in the yellow and red part of the spectrum. The remaining blue photons are emitted unaffected and combine with the yellow and red light to produce white (see the TechZone article “Whiter, Brighter LEDs”).
Figure 4 shows the relative spectral emission from an OSRAM OSLON SSL white LED (this chip has an efficacy of 106 lm/W at 350 mA/2.95 V). Note that large peaks occur in the blue region (the direct contribution from the LED), with a further hump in the yellow and red region produced by the phosphor.
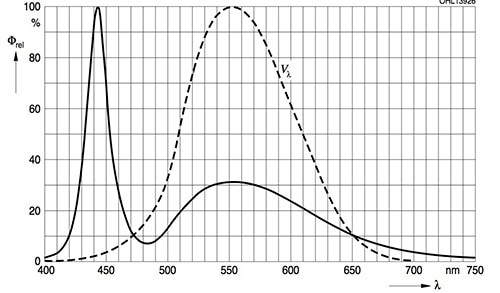
Figure 4: Spectral Power Distribution from an OSRAM OSLON SSL white LED. The dashed bell curve is the human eye sensitivity function.
Perfect artificial light
Although the CIE color space predates commercial LEDs by several decades, the fact that pure-color LEDs allied with wavelength-shifting phosphors are a near-ideal artificial light source for matching the SPD of a black body radiator and limiting energy emission to the visible spectrum makes the diagram an ideal mechanism for developing and characterizing white LEDs.
To compete with conventional lighting, LED makers strive to produce quality products. Color Rendering Index (CRI) and Color Correlated Temperature (CCT) define light quality from the devices.
CRI is a quantitative measure of the ability of a light source to reproduce the colors of various objects faithfully in comparison with an ideal or natural light source. Sunlight is used as a benchmark and has a CRI of 100 (see the TechZone article “What Is the Color Rendering Index and Why Is It Important?”). Contemporary LEDs such as Cree’s XLamp XM-L2 chips (153 lm/W at 700 mA/2.9 V)) and OSRAM’s OSLON SSL family have CRIs in the range of 80 to 85.
While CRI is not defined in the CIE color space, CCT most definitely is. CCT is defined as “the temperature of the Planckian [or black body] radiator whose perceived color most closely resembles that of a given stimulus at the same brightness and under specified viewing conditions.”
By making slight changes to the phosphor chemistry, manufacturers can alter the CCT of their white LED. Figure 5 shows how the spectra of white LEDs with different CCT vary. This example shows LEDs from Cree’s XLamp XM-L2 family.
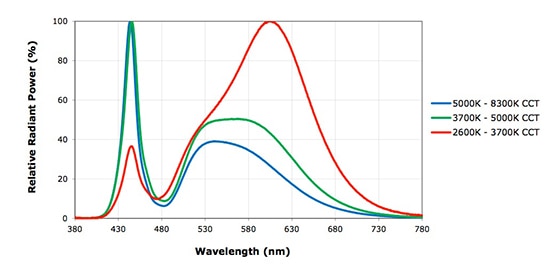
Figure 5: Relative spectral emissions for Cree white LEDs of varying CCT.
Note that the “warmer” white LEDs actually have lower CCTs. The output from these devices contains more red wavelengths, which shifts the radiation toward the cooler end of the Planckian locus even though human perception dictates that the color is warm. “Cool” white LEDs emit more blue, and the radiation is classified as hotter, although again, humans have an alternative perception that determines the light is cooler. Manufacturers produce white LEDs with outputs classed as “warm white” (2600 to 3700 K CCT), “neutral white” (3700 to 5000 K CCT) and “cool white” (5000 to 8300 K).
These product ranges suit different applications. For example, consumers prefer warm-white devices in the home, while businesses find that employees are more productive under cool-white illumination.
It is impossible to reliably manufacture LEDs of exactly the same CCT. Instead, manufacturers group devices with similar CIE color coordinates into “bins.” The groupings are determined by small quadrilaterals on the CIE color space with vertical sets of these quadrilaterals having the same CCT (see the TechZone article “Defining the Color Characteristics of White LEDs”).
Superior LEDs by design
Consumers are willing to replace short-lived and inefficient traditional light sources with solid-state lighting if manufacturers can supply products emitting high-quality light. The CIE color space had proved an invaluable tool for LED makers developing such products because it takes into account the eye’s varying sensitivity to light of different color and incorporates a key reference for artificial lighting in the form of the Planckian locus defining the color of emissions from black bodies of increasing temperature.
For more information about the parts discussed in this article, use the links provided to access product information pages on the DigiKey website.
References
1. “Light Emitting Diodes,” F. Schubert, Cambridge University Press, 2004.
免责声明:各个作者和/或论坛参与者在本网站发表的观点、看法和意见不代表 DigiKey 的观点、看法和意见,也不代表 DigiKey 官方政策。


 中国
中国