How to Run AC Circuit Simulations in LTspice
2024-11-06 | By Jake Hertz
Simulating AC circuits is a fundamental skill for electrical engineers aiming to analyze and optimize circuit performance before physical implementation. To do this, LTspice is an industry-standard free simulation tool that offers robust features for conducting precise AC analyses.
In this guide, we'll walk through simulating an RLC Bandpass Filter, a circuit designed to pass a specific band of frequencies while attenuating others. This step-by-step guide will help you set up the simulation, analyze the results, and refine your design as needed.
Prerequisites
Before diving into the simulation process, ensure you have:
- LTspice Installed: Download and install the latest version of LTspice from Analog Devices using this link.
- Basic Understanding of AC Circuits: Familiarity with RLC circuits, resonance, and bandpass filter behavior will be helpful.
- Circuit Schematic Ready: We’ll use an RLC circuit as our example.
Step 1: Launch LTspice and Create a New Schematic
- Open LTspice on your computer.
- Create a New Schematic by clicking on File > New Schematic or pressing Ctrl + N.
- Save the Schematic immediately by clicking File > Save As and giving it an appropriate name. This practice prevents data loss and organizes your projects efficiently.
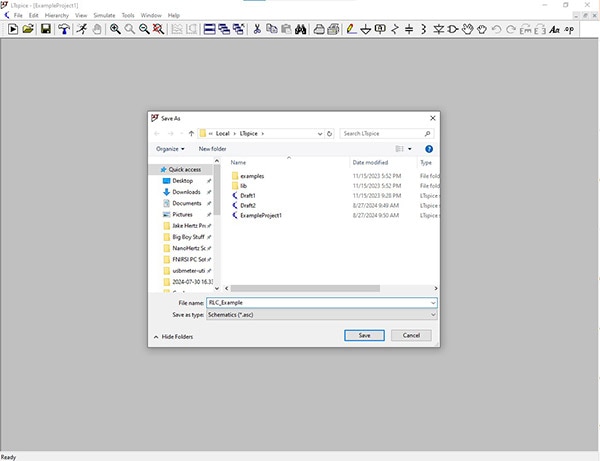 Saving a new schematic in LTSpice.
Step 2: Build the RLC Bandpass Filter Circuit
1. Insert Components:
- Click on the Component symbol (an AND gate icon) or press F2.
- Search for and place the following components:
- Resistor (R) – one for the resistor in the RLC circuit.
- Inductor (L) – one for the inductor.
- Capacitor (C) – one for the capacitor.
- Voltage Source (V) – for the AC input.
- Arrange the components in a series configuration as follows:
- R connected to L, and Lconnected to C. The other side of the C is connected back to the ground.
2. Connect Components:
- Use the Wire tool (pencil icon) or press F3 to connect the components in series, with the AC voltage source connected at one end of the resistor and the other end of the capacitor connected to the ground.
3. Configure Component Values:
- Right-click on each component to set their values:
- Resistor (R): Set to 100Ω.
- Inductor (L): Set to 100mH.
- Capacitor (C): Set to 100nF.
- The resonance frequency of an RLC circuit is determined by the circuit's inductance and capacitance. At resonance, the inductive reactance and capacitive reactance are equal in magnitude but opposite in phase, effectively canceling each other out.
- The resonant frequency
 of an RLC series circuit is given by the formula:
 - These values create a bandpass filter that should resonate at approximately 1.6 kHz.

4. Assign Ground Reference:
- Press G to place the ground symbol at the other end of the capacitor. The ground is essential for simulation.
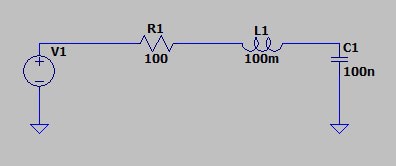 Our RLC bandpass filter implementation in LTSpice.
Step 3: Define the AC Voltage Source
1. Configure the Voltage Source:
- Right-click on the voltage source to open its properties.
- Click on Advanced
- In the dialog box, set:
- AC Amplitude: Enter 1V for the AC amplitude.
- This setup ensures the voltage source will provide an AC signal for analysis across the frequency range.
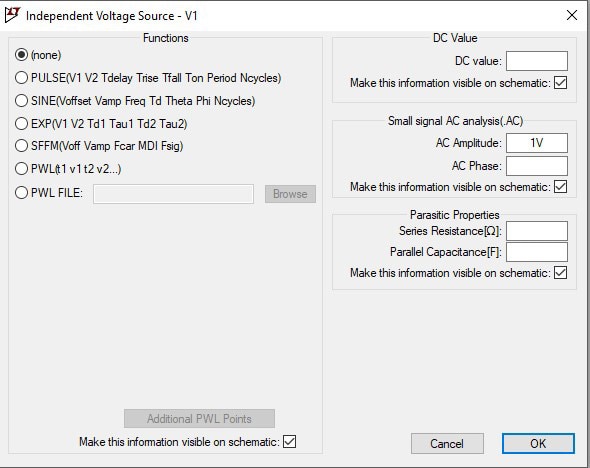 Setting up our AC voltage source.
Step 4: Set Up the AC Analysis Command
1. Open Simulation Command Dialog:
- Click on Simulate > Edit Simulation Cmd....
2. Configure AC Analysis Parameters:
- Select the AC Analysis tab.
- Choose the sweep type:
- Decade: Ideal for visualizing frequency responses over a wide range.
- Set Number of Points per Decade: 100 points ensure a smooth plot.
- Define Start Frequency and Stop Frequency: Set the range from 100Hz to 10kHz to cover frequencies around the expected resonant frequency.
3. Add the Simulation Command to Schematic:
- Click OK to generate the command and place it on the schematic.
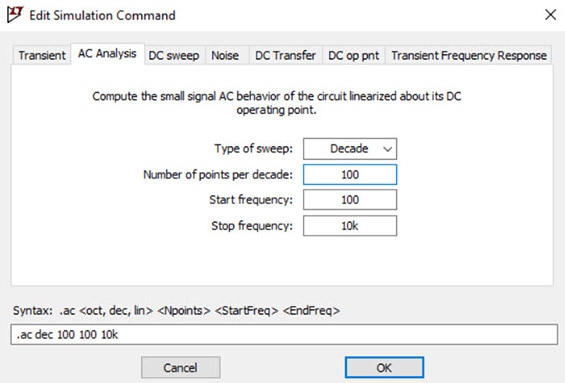 Configuring the AC analysis.
Step 5: Run the Simulation
1. Initiate Simulation:
- Click the Run button (running man icon) or press Ctrl + R.
2. View Results:
- The waveform viewer will open, displaying simulation data.
- Plot Desired Variables:
- Click on the node between the capacitor and the inductor to plot the output voltage across the capacitor.
- LTspice will automatically generate the frequency response curve.
- Analyze the Bode Plot:
- Observe the magnitude and phase response across the frequency sweep.
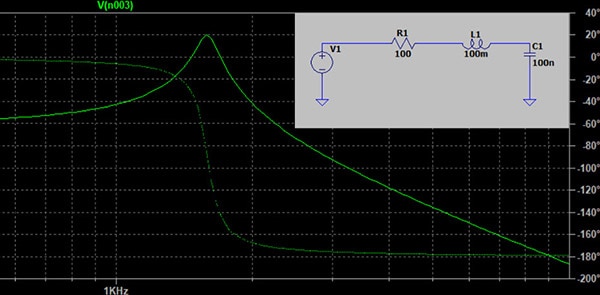
- The peak in the magnitude plot corresponds to the resonant frequency of the RLC bandpass filter.
 The bode plot of our RLC bandpass filter.
Step 6: Analyze and Interpret Results
1. Examine the Frequency Response:
- The plot should show a peak at the resonant frequency, around 1.6 kHz, where the circuit passes the most signal.
- Frequencies far from this peak should show significant attenuation.
2. Validate Circuit Performance:
- Compare the simulated resonant frequency with the expected theoretical value, calculated using the formula:

Conclusion
Mastering these simulation techniques with LTspice will empower you to optimize complex circuits and develop a deeper understanding of AC circuit behavior, leading to better-informed design decisions and successful engineering outcomes. By following this step-by-step guide, you can explore the behavior of your RLC circuits across a wide range of frequencies, identify the resonant frequency, and adjust component values to achieve your desired performance.
Have questions or comments? Continue the conversation on TechForum, DigiKey's online community and technical resource.

 of an RLC series circuit is given by the formula:


