How-To: Read and Understand Technical Datasheets
2024-04-17 | By Maker.io Staff
 Image Source: https://pixabay.com/photos/drawing-plan-design-sketch-project-933207/
Learning to read and use datasheets effectively is crucial for anyone working with electronic components. These documents serve as detailed user guides for electronic parts, and they contain vital information that enables the correct usage and functioning of electronic parts in various designs.
Understanding the Main Sections of Datasheets
Most datasheets generally contain the same information and are arranged similarly. You can typically find sections that detail a part's electrical characteristics and the component's absolute maximum ratings, pin configurations, layouts, and package sizes. Usually, technical documentation also contains timing diagrams and graphs that correlate how changes in various factors, such as environmental temperature or humidity, affect a part's performance.
Datasheets for digital components, especially those implementing a communication protocol, often contain timing diagrams. These diagrams explain at what rate bits may arrive at the chip's input or how fast input changes affect the chip's output levels. Some datasheets for ICs, especially those that implement logic functions, also contain truth tables. These tables describe how the input values of the chip's input pins affect the output produced by the IC.
The datasheets of parts like microcontrollers and microprocessors usually also detail the memory layout of the component and supported instructions for writing programs.
Traversing a Datasheet with Ease
Efficiently finding information in a part’s documentation starts by identifying the component itself. Many standard parts come in various package sizes, with varying characteristics influencing the component’s electrical behavior. However, these variations are commonly summarized in a single datasheet with tables containing different entries for the variations.
Take, for example, the following datasheet for a standard eight-bit shift register IC. The table on the bottom right lists some of the part numbers this document covers.
 This screenshot shows a typical example of a datasheet’s first page. It contains a list of the most common device variants covered in the document, as well as a general overview and feature list that applies to all variants. Image source: https://www.ti.com/lit/ds/symlink/sn54hc595-sp.pdf
The first page usually contains a short, high-level functional description of the part and a bullet point list of its most essential features and electrical characteristics. This list usually includes the input voltage, output power, and switching characteristics. The first page commonly also shows the part's high-level functional block diagram, and manufacturers sometimes list intended target applications.
The best way to start reading through a datasheet is by familiarizing yourself with the high-level information on the first page to understand what the part does and how to use it in a circuit.
Learning About Pin Configurations
A component's datasheet is immensely useful when designing a circuit or PCB, as a part's technical documentation usually contains the physical dimensions and possible manufacturing tolerances you can use to create the pads and mounting holes needed to use a part in your design.
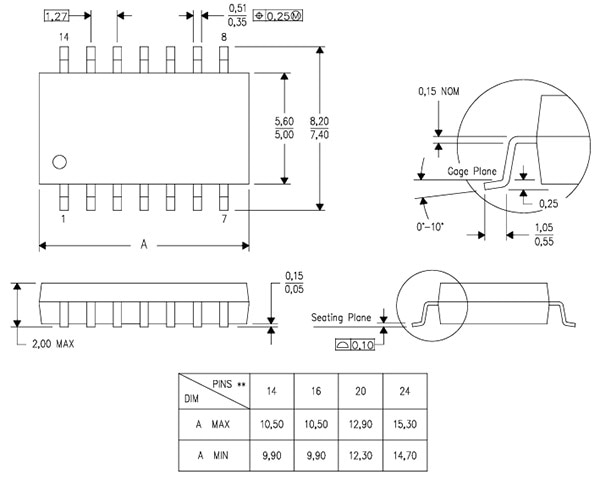 Technical datasheets contain detailed drawings that show the dimensions and manufacturing tolerances of all available packages. Designers can use these parts to create custom parts in their PCB design software. Image source: https://www.ti.com/lit/ds/symlink/sn54hc595-sp.pdf
Many PCB design programs already include the most common parts, so you will likely find the pinout description of a component more useful. Pinout drawings are typical in datasheets for integrated circuits. A pinout describes the function of each pin on the IC package, particularly helpful during prototyping without a PCB design.
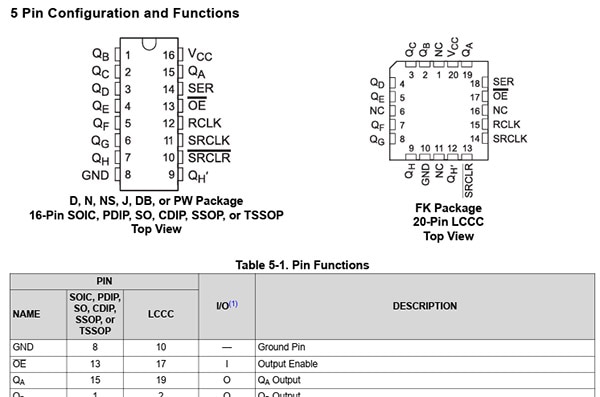 The pinout drawing explains the function of each pin of a device. A supplementary table typically provides further details. Image source: https://www.ti.com/lit/ds/symlink/sn54hc595-sp.pdf
Datasheets contain one pinout diagram per package, and the drawing is usually supplemented with a table that lists the function and associated pin number on each package.
Answering More Detailed Questions
Most non-trivial designs require you to dig deeper into a datasheet, beyond the first page. Understanding the absolute maximum ratings of a part is essential to ensure its proper functioning over its entire lifetime. Staying below these values at all times is vital to prevent damage and malfunctioning.
One example is the absolute maximum supply voltage that must not be exceeded to prevent damage to a component. Aside from the voltage, most datasheets also contain maximum ratings for the current and technical limitations, such as the maximum clock frequency.
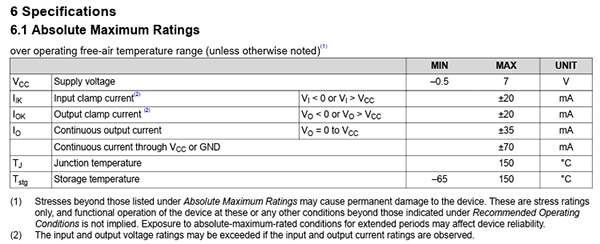 This table lists the shift register’s maximum supply voltage, allowed currents, and the safe operating temperature range. Image source: https://www.ti.com/lit/ds/symlink/sn54hc595-sp.pdf
The recommended operating conditions summarize the parameters the component’s manufacturer suggests for prolonged use. Staying close to these values guarantees correct functioning and reliability over the part’s expected lifetime, typically also denoted in the datasheet.
 Aside from listing the minimum, nominal, and maximum recommended operating conditions, this table also contains information on how fast the chip reacts to input changes under certain circumstances. In this instance, the chip’s input transition times decrease when the input voltage increases. Image source: https://www.ti.com/lit/ds/symlink/sn54hc595-sp.pdf
Leveraging Truth Tables and Timing Diagrams
When working with digital components, you may want to take a closer look at truth tables and timing diagrams to better understand the IC’s behavior. Truth tables are an easy way of illustrating how the inputs of a digital component affect the part’s output.
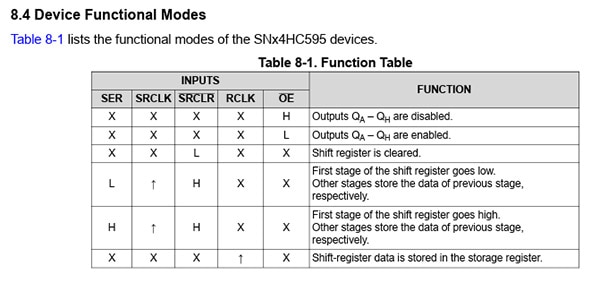 Truth tables list all possible input combinations and how they affect the output. The effect can be given as a description or by denoting concrete output values, such as a digital state. Image source: https://www.ti.com/lit/ds/symlink/sn54hc595-sp.pdf
Truth tables, sometimes called function tables, list all possible input combinations and how they affect the chip’s output. In this example, the author denoted a functional description of the outputs instead of giving the exact values.
When reading truth tables, an L indicates a low input/output, and H represents a high state. An X stands for “don’t care,” meaning that the state of an input doesn’t affect the output in a specific instance. It could be high or low without affecting the output. An up-arrow indicates a rise from a low to a high state, and conversely, a downward-pointing arrow represents that this pin transitions from a high to a low state.
For example, the last row describes that regardless of the input pins SER, SRCLK, SRCLR, and OE, the chip stores the data in its register when RCLK changes from low to high.
Timing diagrams offer even greater insight into a chip’s behavior when specific input values change. These diagrams also illustrate the exact order and delays between state changes. Using timing diagrams, you can also learn how long specific inputs must remain stable for the chip to detect them as valid inputs, a step that is especially important when implementing communication protocols.
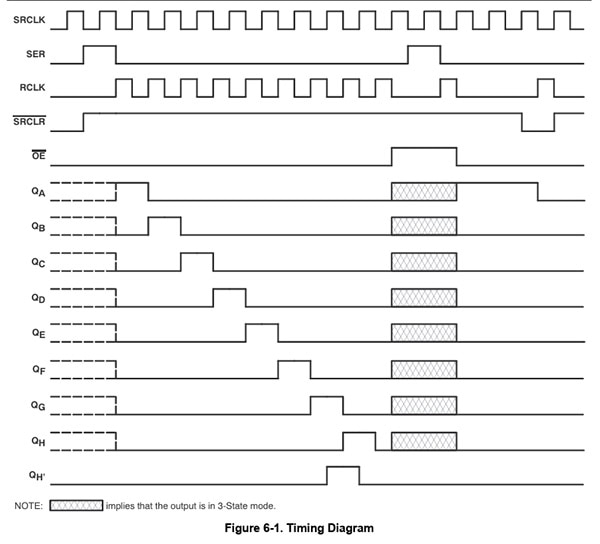 Timing diagrams offer greater insight into a part’s behavior and the order of state changes. Image source: https://www.ti.com/lit/ds/symlink/sn54hc595-sp.pdf
Diving Deeper into Datasheet Plots and Graphs
Finally, you may want to study the various plots that correlate changes in input or environmental parameters to changes in a part’s behavior. These plots are typically located toward the end of the datasheet.
 This example contains four plots that correlate various physical properties. The lines in each graph correspond to one of the part’s minimum, maximum, and optimum operating conditions. Image source: https://www.ti.com/lit/ds/symlink/lm555.pdf
For example, figure 2 illustrates how the supply voltage and current correlate. The three individual lines in the graph correspond to this particular part’s absolute minimum (-55°C) and maximum (+125°C) operating temperatures, as well as the chip’s behavior at the recommended operating temperature (+25°C). As a more experienced maker, you can gain important insights about how a component performs under various conditions from plots like these to increase the reliability and resilience of your electronic designs.
Summary
Datasheets are the technical documentation for electronic parts and serve as the components' user manual. As engineers are the target audience of datasheets, these documents can be daunting at first, especially to newcomers. However, even as a beginner, you can follow a systematic approach when reading the datasheet to make the most of it.
Usually, you will find the first page of a datasheet most helpful. This page typically contains a high-level summary of the component, its typical characteristics in optimum conditions, target applications, a simple functional diagram, and the different part numbers.
Next, you should find the section that lists the optimum operating conditions and the absolute maximum ratings. You want to design your circuit so that the part typically operates within optimum conditions and is not driven above the absolute maximum ratings.
As a more experienced maker, you will find great value in the more detailed timing diagrams of digital components. Truth tables summarize how the inputs of a chip affect its output pins. Finally, most datasheets also contain graphs that correlate specific operating conditions to the part's behavior in these conditions. A graph, for example, could illustrate how the output current changes with varying input supply voltage levels.
Have questions or comments? Continue the conversation on TechForum, DigiKey's online community and technical resource.


