Tools to Program and Debug MCUs
投稿人:电子产品
2011-11-16
There was a time that programming microcontroller units (MCUs) required programmer tools to load the code, emulators to try it out, and debuggers to help locate and fix errors. Today, sophisticated programmer/debugger tools provide more capabilities at a very economical price point. Used with integrated development environments (IDEs), they provide an avenue to more effectively program and debug the devices with a single component, lowering development costs and speeding time-to-market.
Debugging involves three major elements: the IDE, the debugger engine, and the programmer/debugger tool. The IDE runs on a computer and typically includes elements such as a source-code editor, compiler, and software libraries for commonly used subroutines (drivers, etc.). The debugger engine consists of debug circuitry integrated into the MCU. The programmer/debugger tool interfaces with the target device and interrogates it during the process of testing the code, relaying performance and fault information to the developer.
The basic process of programming an MCU involves first developing the code in a higher-level language, typically in C or C++, and compiling the code. Next, the programmer tool ports the code from the IDE into an emulator designed to mimic the performance of the MCU, or the MCU itself.
An emulator provides a test interface that generates the appropriate output signals, along with a sophisticated range of debug tools. The modular STice system from STMicroelectronics emulates their STM8 MCUs at clock speeds of up to 50 MHz. With coverage analysis on code or data, the system offers unlimited instruction breakpoints for the entire MCU memory space, as well as data breakpoints, and advanced breakpoints with up to four levels of user-configured conditions.
Increasingly, the trend is toward skipping emulators and integrating the debug engine directly into the chip itself. Indeed, the STice system also provides in-circuit debugging/programming of the actual MCU via a single-wire interface module (SWIM). The shift is partly a function of more sophisticated chip fabrication techniques and partly a function of today's higher-speed chips. Indeed, developers often have to test on the actual MCU because emulators can no longer adequately simulate them.
Although the debugging engine occupies precious real estate on the controller, it can be implemented with surprisingly low cost and typically does not impose a speed or power penalty on operation. At the same time, the integrated approach provides multiple benefits. Programmers/debuggers designed for testing on the MCUs themselves can cost four to 20 times less than an emulator. They can also speed time to market. Instead of following a two-step process of testing and implementation, developers can perform all test and debugging on the same hardware that will be seen in production, an approach that minimizes the chances of problems and delays. If the development team finds a bug during the production process, they can develop a solution, deploy new firmware into the target device, and get it up and running rapidly.
Perhaps most important, what developers see is what they get. With emulators, there is a possibility that the test version does not exactly mirror the performance of the actual chip. With debugger engines integrated directly into the silicon, developers can be assured that the performance they see during the programming process is exactly what they will encounter during release.
Choosing the right debugger
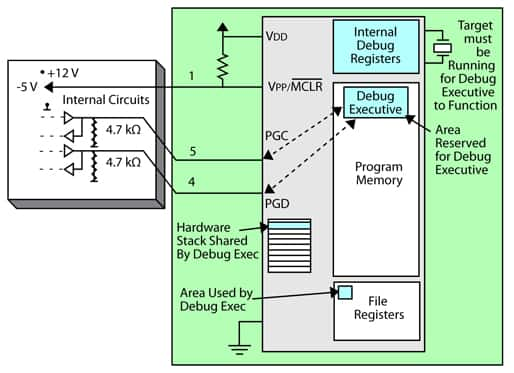
Different microcontrollers and programmers/debuggers have different features and levels of sophistication. The PICkit 3 programmer/debugger from Microchip Technology for example, allows users to define hardware breakpoints and establish breakpoints based on internal events like data fetch or write, or stack overflow (Figure 1). It can also monitor internal file registers. The tool provides 512 Kbytes of EE program image space. It also sports a true voltage reference, and a voltage range of 1.8 to 5 V VDD (1.8 to 14 V VPP).

Figure 1: The PICkit 3 programmer/debugger as set up for debugging. This diagram shows internal protection circuitry. (Courtesy of Microchip Technology.)
At the next level of complexity, the MPLAB ICD 3 accommodates processors running at maximum speeds and the capability to incorporate I/O port data input.
STMicroelectronics partners with Raisonance for its STX-RLINK evaluation kit for selected MCUs. Driven by the Ride7 IDE, the tool provides in-circuit debugging of up to 32 Kbytes of code and supports SWIM, in-circuit communication (ICC) and Joint Test Action Group (JTAG) protocols. The software also allows it to be used for in-circuit programming of some MCUs.
More sophisticated tools can provide data capture, allowing the user to watch a data variable change in the IDE in real time. Debugger engines can provide complex breakpoints, allowing the developer to define not just stopping points in the execution of the code, but other subtleties such as having the execution halt after a subroutine has been repeated a set number of times, whereupon the system can interrogate the registers and send the output to the IDE. In other instances, the engine can capture a hardware trace, showing the output signals of the chip and the various instruction sequences.
Microchip’s MPLAB REAL ICE in-circuit emulator system, for example, which interfaces directly to the target MCU, can log instruction execution and variable contents at rates of 10 Kbytes/s for a 4 MHz, 16-bit core. Users have the choice of streaming parallel trace using device I/O port or streaming serial trace using SPI/UART. The probe drivers feature protection circuits to prevent damage from power surges generated by the target. For demanding applications, low-voltage differential signaling (LVDS) provides high-speed, low-noise conductivity over a distance as great as three meters.
The debugger can put breadcrumbs in the code to allow tracking, and then signal that the code has reached point A, point B, point C, etc. This approach allows developers to follow the flow of the code and check for correct execution of subroutines, allowing users to dig more deeply into the code and more easily discover problems.
With a wide range of options available, you can easily find a programmer/debugger tool with the right feature set for your application. It's important to be aware that the terminology tends to be somewhat fluid in this space—some tools are called programmers but also debug, others are called emulators/debuggers but connect to the target device to run the code. In still other cases, emulators can be used to debug the actual chip. Pay close attention to the datasheet to ensure that you’re getting the performance you need.
免责声明:各个作者和/或论坛参与者在本网站发表的观点、看法和意见不代表 DigiKey 的观点、看法和意见,也不代表 DigiKey 官方政策。


