Sensors for Temperature Measurement and Their Application
2015-06-04
It is very rare today to see electronic equipment that has not undergone extensive thermal evaluation, either by measurement or simulation. Inevitably, the device junction or case, or the enclosure, have been measured to ensure that the system will operate to its intended specifications.
A quick look at the equations associated with stress in a lead wire, and with the acceleration factor used in reliability calculations, will show why temperature plays such an important role in electronics equipment.1
 (1)
(1)
Where,
E = Modulus of elasticity
Le = Wire-bond characteristic length
RA = Aspect ratio of the deformed section
R = Non-deformed wire radius
T = Temperature
s = Stress at the wire-bond attachment
l = Stress concentration
And the acceleration factor,
![]() (2)
(2)
Where,
AT = Temperature acceleration factor
Ea = Activation energy
kB = Boltzman constant
e = Relates to reaction dynamics (0.7)
T = Temperature (K)
Equations 1 and 2 clearly demonstrate the linear or exponential relationships that temperature has in the operation of the electronic components. Simulation tools are used extensively in today’s thermal design. However, due to the complexity of the electronics packaging and composite nature of the materials used, the simulation data must be verified. In this article, we present different sensors and their application domains in electronics thermal management.
Table 1 shows six primary sensors used in temperature measurement:
| Transducer or Probe | Temperature Sensitive Parameter | Contact Method | Remarks |
| Resistor | Electrical resistance or voltage at constant current | Direct Contact | Usually calibrated against a thermocouple |
| Thermocouple | Open circuit voltage | Direct Contact | Useful as a "point" sensor |
| Diode or Transistor | Voltage, usually with constant forward bias current | Direct Contact | Usually employed to measure an active device or IC temperature |
| Infrared or radiation | Detector voltage | Line-of-site or optical contact | Yields a temperature map or image. Not strictly quantitative unless sample emittance is known at all image points |
| Fluorescent Detector | Detector voltage | Direct contact (proximity) | Approximate point detector; contact resistance a problem |
| Liquid Crystal | Color | Direct Contact | Yields a temperature map; semi-quantitative unless a detailed calibration is performed to quantify color vs. temperature relation |
Table 1: Standard temperature transducers.2
1 — Resistance thermometer
With these sensors, the resistance of the sensing element changes with temperature. The sensors come in two primary forms: thermistors (lightly doped semiconductors) and metal resistors. Equations 3 and 4 represent the relationships between resistance and temperature for these two sensors, respectively:
 (3)
(3)
![]() (4)
(4)
Where,
C1 and C2 = Constants
KB = Boltzman constant
R0 = Resistance at reference temperature
R(T) = Resistance at temperature T
T0 = Reference temperature in °K
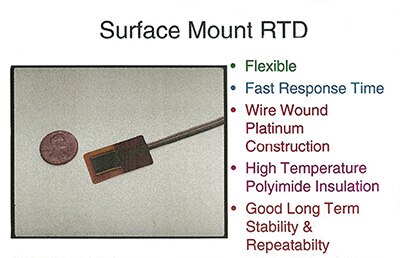
Figure 1 shows a surface-mounted RTD (resistance temperature detector) that can be installed onto a surface for temperature measurement.

Figure 1: Surface-mounted RTD (courtesy of RDF Corporation).
The following must be considered when using these types of sensors:
- The sensor (resistor) must be in intimate contact with the test specimen — solder or careful epoxy is recommended.
- The sensor must be placed in an isothermal region — constant temperature over the sensor.
- The resistor power dissipation (if in voltage mode) must be minimized to not impact the problem.
- This sensor is suitable for part-level measurement as it can be embedded directly on the die.
2 — Thermocouples (TC)
These sensors are far and away the most commonly used devices in the field. Wide flexibility and broad availability enable their use for a variety of temperature measurements. TCs work on the principle that bringing together two wires of different elements or alloys produces a voltage as a result of temperature. Equation 5 provides the governing principle for TCs:
 (5)
(5)
Where,
VTC = Voltage produced by the thermocouple
aA,B = Seebeck coefficient for wires A & B
T = Temperature
Table 2 shows some of the typical TC types that are used in the electronics thermal measurement.
| Type | Material A | Material B | V Output (µV) | Norm. error lim. ± ºC | Remarks |
| B | Platinum -30% rhodium | Platinum -6% rhodium | 1 | 0 | Not useful below 50ºC; best for very high temperature measurements |
| E | Nickel-chromium alloy | Copper-Nickel alloy | 62 | 1.7 | Well-suited for low temperature measurements |
| J | Iron | A different copper-nickel alloy | 51 | 2.2 | Iron P leg subject to variations in Seebeck coefficients from impurities |
| K | Nickel-aluminum alloy (Alumel) | Nickel-aluminum alloy (Alumel) | 40 | 2.2 | Very popular for electronics cooling experiments |
| R | Platinum -13% rhodium | Platinum | 7 | 5 | Very stable |
| S | Platinum -10% rhodium | Platinum | 7 | 5 | |
| T | Copper | Copper-Nickel Alloy | 40 | 1 | Copper leg could create a conduction path (fin) in surface temperature measurements |
Table 2: Thermocouple types and their respective voltage outputs.2
Of the TC types shown above, E, J, K and T are the most commonly used. Many thermocouple meters on the market can use all of these sensors interchangeably. That’s because the voltage output of these TCs is in the same range; hence, the internal electronics can be designed to accommodate each of them.
There are some unique features about each sensor type that one needs to know. For example:
- E-type — Though accurate, has a limited range
- J-type — Should not be used in a humid environment, since the iron component of the TC will oxidize, resulting in erroneous output
- K-type — Though widely used, the voltage output can be negatively impacted if the wire kinks
- T-type — Can be an effective heat transfer medium, because of its copper component, either as a fin or a conductor
It is also important to note that thermocouples measure temperature at the point where the two wires are connected. The smaller the junction, the more precise the temperature reading that can be obtained. A large TC junction will result in the temperature being averaged over its entire area. Multiple junctions, as shown in Figure 2, will have the same impact.
In Figure 2, the multi-junction created as a result of twisting the wires prior to spot-welding the ends (the TC on the right), creates a significantly larger junction. Whether measuring surface or fluid temperatures, the number reported by this TC will report an average temperature over a 2-3 mm junction length.
Thermocouple errors can be attributed to the following areas:
- Poor junction connection
- Galvanic action
- Thermal shunting
- Electrical noise
- Installation problem due to tester

Figure 2: Single- and multi-junction thermocouple sensors.3
Of the errors listed above, electrical noise is uniquely problematic, especially in today’s high-frequency equipment. A TC can be used in a 4-wire format to resolve the electronic noise that may affect the reported temperature. Using a 4-wire thermocouple, as shown in Figure 3, we can measure temperature and electrical noise.
Let us consider a J-type thermocouple formed of Iron and Constantan. All four wires are spot-welded together to form the TC junction. The temperature can be read across any of the Iron and Constantan combinations, and the electronic noise can be read across either the two Irons or the two Constantans. Because two similar metals cannot create the Seebeck effect (convert thermal differentials to electric voltage), whatever signal is measured on these wires is the electronic noise in the measurement domain.

Figure 3: Four-wire thermocouple system for measurement of electronic noise and temperature.
Measuring surface temperature is always a challenging process. The following steps will help to increase the accuracy of such measurements:
- Keep installation size as small as possible
- To reduce conduction errors, bring thermocouple wires away from the junction, along an isotherm for at least 20 wire diameters
- Locate the measuring junction as close to the surface as possible
- To avoid changes in convective or radiative heat transfer, design the installation so that it causes minimum disturbance to any fluid flow or the least possible change in the emissivity of the surface
- Reduce the thermal resistance between the measuring junction and the surface to as low a value as possible
3 — Diode or transistor
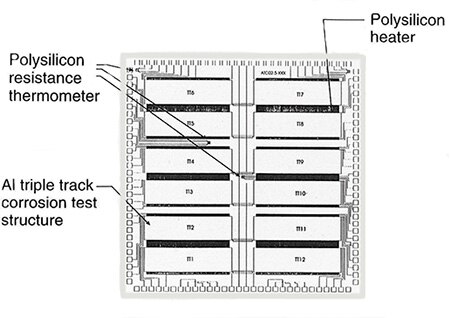
Diodes and transistors are parts whose electrical properties are a function of temperature. Diodes are broadly used for temperature measurement, either as embedded sensors in functional devices or as a thermal test chip. Figure 4 shows one such thermal test chip for device-level simulation.

Figure 4: Thermal test chip for device-level simulation.
The following depicts the general considerations for usage of semiconductor materials for temperature measurement:
- Every semiconductor device has at least one electrical parameter that is a function of temperature
- Thermal test chips use the thermally sensitive parameter of semiconductor devices to measure chip junction temperature
- Separate heating and sensing elements are usually used to avoid the need for electrical switching
- Thermal calibration of the sensing device is necessary
- Thermal test chips provide an effective means of measuring chip junction temperature in an actual package configuration
- Use of materials is subject to availability/suitability for the intended package application
4 — Infrared thermography
Infrared thermography works on the basis of the IR waves emitted from a heated surface. The infrared system captures the waves, and based on internal calibration, converts them into temperature.
The following are required for IR-based measurements:
- Infrared imaging system -- The market offers a broad range, but a worthy system starts at around $30-70k. For IR microscopy (down to 5 mm only- lower limit of IR wave-length), the system starts at $180k
- Signal processing equipment
- Knowledge of emissivity – if the test specimen must be coated with a known emissivity material
- Calibration
Figures 5a and 5b show a typical IR image of heat-emitting surfaces.

Figures 5a and 5b: IR images of a circuit board in forced (a) and natural (b) convection.3
The following points are noteworthy when using an IR camera for temperature measurement:
- Application accuracy is a function of emissivity
- The measurement situation must duplicate the actual environment, as far as air velocity, temperature and air flow distributions are concerned
- The IR camera is sensitive to reflected radiation
- Carbon dioxide and water vapor absorb significant energy and may cause significant error
- In an electronics application, surfaces typically have different emissivities. Thus, one must make the emissivity uniform before measurement of known emissivity (black paint or powder)
- In most IR equipment, the temperature readout is the average over an area. Therefore, temperature peaks may be ignored as the result of integration. To remedy the situation, better IR optics must be used to reduce the area where integration occurs
5 — Optical probes
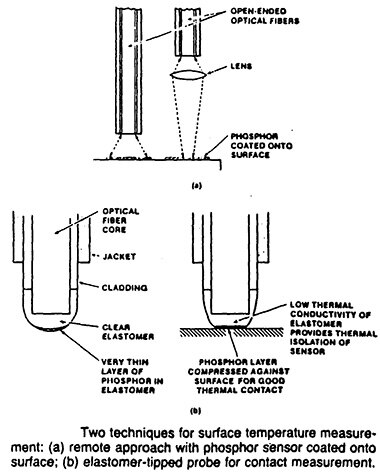
Optical sensors are light-emitting devices that illuminate the test body with source radiation, and can detect reflected radiation, or simulated radiation such as fluorescence. Although not broadly used, optical probes are used at the die or component level. Figure 6 shows one such a probe.

Figure 6: Optical probe for surface temperature measurement — the probe either touches the surface or captures the reflected light from a fluorescent treated surface.
6 — Liquid crystal thermography
LC thermography works on the basis of visible light reflected from a surface treated with the LC material. The system captures the reflected wavelengths, and based on internal calibration, converts them into temperatures. Liquid crystals (LCs) are cholesteric materials. When applied to a heated surface they realign and reflect light at a different wavelength. The reflected light shows the standard colors seen in a rainbow. Figure 7 shows the application of LCs on an IC.

Figure 7: Color display of liquid crystal applied on an IC. Blue reveals the circuit’s hottest point, and black shows that the temperature is outside the range of the crystal material.3
The following are salient features of LC material:
- Liquid crystals are organic compounds that can be poured like a liquid; yet reflect light like a crystal
- Changes in LC optical properties can be produced by externally applied fields (e.g., electrical, magnetic, and thermal)
- Cholesteric liquid crystals progressively exhibit all colors of the visible spectrum when heated over their event temperature range
- Width and placement of the event temperature range can be controlled by selecting and mixing the appropriate liquid crystals
- Liquid crystals are commercially available with event temperatures ranging from below 0ºC to 160ºC, with spans ranging from 1 to 50ºC
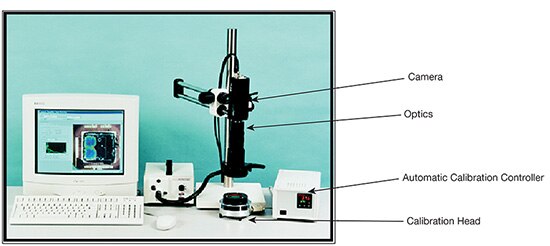
An LC thermography system such as the one shown in Figure 8 can provide a very effective temperature-mapping system.

Figure 8: The thermVIEW™ system for macro and microscopic (down to 1 µm) surface temperature measurement.4
Figure 9 shows a typical result of LC thermography at die level.

Figure 9: Temperature distribution across a memory chip (5 x 5 mm) at Tambient = 25oC, as shown using Liquid Crystal Thermography.3
Like any other system for temperature measurement, LC thermography offers distinct advantages and disadvantages. One salient advantage of LC thermography is that it’s not dependent on surface emissivity. A second is that at micron and submicron levels, though not a trivial task, LC thermography allows easier and less costly temperature measurements while enabling 1 µm or smaller spatial resolution. One disadvantage of LC thermography is that it is not a pick-up-and-measure system like IR. One must apply the calibrated liquid crystal material to a surface in order to perform the measurement. However, this is similar to the IR system, in that you need to make the surface emissivity uniform if the measured surface has multi-emissivity (e.g., a die or PCB).
In this article, we reviewed six different probes/techniques for temperature measurement. It would be a missed opportunity not to include a word on calibration. Irrespective of the types of measurement and sensors one uses, calibration is of utmost importance. Pay special attention to the calibration process and ensure that the sensors are properly calibrated. Further, one needs to ensure that the chosen sensor is suitable for the type of measurement. As Prof. Frank White states in his Viscous Flow book, “Bad data is worse than no data at all”.5
References
- Klinger, D., Nakada, Y., Menendez, M., AT&T Reliability Manual, Van Nostrand Reinhold, 1990.
- Azar, K., Thermal Measurement in Electronics Cooling, CRC Press, 1997.
- Advanced Thermal Solutions, Inc., Tutorial Series, “Principles of Temperature Measurement”.
- thermVIEW™ System, product of Advanced Thermal Solutions, Inc.
- White, F., Viscous Fluid Flow, McGraw-Hill, 3rd Ed., 2005.
This article was first posted in Qpedia Thermal eNewsletter (a newsletter written and published by the engineers of Advanced Thermal Solutions, Inc.) in May, 2007.
免责声明:各个作者和/或论坛参与者在本网站发表的观点、看法和意见不代表 DigiKey 的观点、看法和意见,也不代表 DigiKey 官方政策。


 中国
中国