Raspberry Pi Pico and RP2040 - C/C++ Part 2 Debugging with VS Code
2021-05-17 | By ShawnHymel
License: Attribution
Print statements are a good start, but step-through debugging and the ability to peek at memory values are extremely helpful when trying to find bugs or look for inefficiencies. In this tutorial, I will walk you through the steps needed to configure VS Code to perform step-through debugging with OpenOCD and GDB on the Raspberry Pi Pico.
Note that to set up VS Code to assist with debugging on the Raspberry Pi Pico, you will need the following:
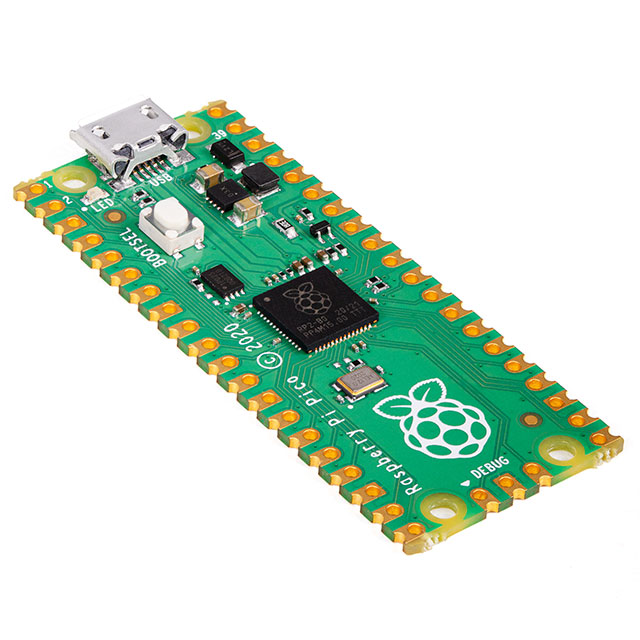
A second Raspberry Pi Pico (to act as the picoprobe hardware debugger)
Follow the steps in the previous tutorial to set up VS Code and the Pico SDK build system
Video
You can find the steps performed in this tutorial in video form here:
How Debugging Works with Picoprobe
We will run our previous blink example on our target pico. However, instead of uploading it using the .uf2 file, we will program the target with blink.elf. The .elf file is a binary with our compiled code, and it contains extra debugging information used to help us with step-through debugging.
We will program a second Pico with the picoprobe firmware and connect it to our target Pico using the serial wire debug (SWD) port. The picoprobe will emulate SWD using its PIO interface in order to send debugging commands to the target Pico.
Note that we will also connect the UART ports together so that the target Pico can send printf() commands to the host computer. The picoprobe also acts as a serial-to-USB converter.
Additionally, the picoprobe will power our target Pico by connecting VSYS and GND pins, so we only need to plug the USB cable into the picoprobe.
Our computer will run a special version of OpenOCD that has been compiled to support the Pico. OpenOCD is a server that communicates with connected microcontrollers/microprocessors and assists with uploading code and debugging.
GDB is the debugging software that accepts commands from the user and controls the OpenOCD server. We will install an extension in VS Code that gives us a graphical debugging interface to GDB. This interface allows us to step through lines of code and peek at memory/variable values in real time on the target Pico.
Hardware Hookup
Solder headers to both sides of both Pico boards. Solder a 3-pin header to the SWD port of your target Pico (I recommend using a female header so you can use male-to-male jumper wires for all of the connections). Connect the 2 Pico boards as shown.
Build OpenOCD
At the time of writing, OpenOCD does not officially support the Raspberry Pi Pico. Hopefully, that will change in the future. So, we need to build a specific Pico version of OpenOCD.
Linux
Run the following commands in a Linux terminal. Note that this is intended for Raspbian, Debian, or other flavors with the apt package manager.
cd ~/pico
sudo apt install automake autoconf build-essential texinfo libtool libftdi-dev libusb-1.0-0-dev
git clone https://github.com/raspberrypi/openocd.git --branch picoprobe --depth=1 --no-single-branch
cd openocd
./bootstrap
./configure --enable-picoprobe ①
make -j4
sudo make i
Note that I do not recommend calling “make install” after building OpenOCD. Because this is a Pico-specific version of OpenOCD, I recommend keeping it separate from other versions of OpenOCD you might use for other embedded debugging.
macOS
Run the following commands in a terminal. Note that you will need to have Homebrew installed.
brew install libtool automake libusb wget pkg-config gcc texinfo
cd ~/pico
git clone https://github.com/raspberrypi/openocd.git --branch picoprobe --depth=1
cd openocd
export PATH="/usr/local/opt/texinfo/bin:$PATH" ①
./bootstrap
./configure --enable-picoprobe --disable-werror ②
make -j4
Windows
As with the previous tutorial, building some of the Pico tools on Windows is frustratingly difficult (as of right now). I recommend building or obtaining OpenOCD using one of these routes:
Follow the guide in Appendix A of the Getting Started guide to build OpenOCD with MSYS2
Follow my tutorial here to build OpenOCD with Git for Windows SDK
Download the executable and required .dll files (that I built) here. Note that from testing, they only seem to run from within Git Bash (or other MinGW environments).
Build and Upload Picoprobe
We need to build picoprobe like any other Pico firmware and upload it to our debugger Pico.
Open a terminal. Note that I’m using Git Bash from within VS Code, so the commands will be similar on Linux and macOS. If you use another terminal in Windows, the commands might be slightly different.
Navigate to wherever you keep your Pico projects. For example, this is “C:\<user>\Documents\Raspberry Pi Pico” for me.
cd <PATH TO PICO PROJECTS>
Enter the following commands to download and build the picoprobe project. Note that you should change the -G option in cmake to one of the following, depending on how you’ve configured your build system:
-G “Unix Makefiles” - Linux or macOS (this is the default for cmake)
-G “NMake Makefiles” - Windows using Build Tools for Visual Studio
-G “MinGW Makefiles” - Windows using MinGW
git clone --recurse-submodules https://github.com/raspberrypi/picoprobe.git
cd picoprobe
mkdir build
cd build
Cmake -G “Unix Makefiles” ..
make
Put your debugger Pico into bootloader mode by pressing and holding the BOOTSEL button while plugging in the USB cable. The Pico should enumerate as a drive on your computer named RPI-RP2.
Copy picoprobe.uf2 to the RPI-RP2 drive.
When it’s done copying, the Pico should automatically reset and begin running the picoprobe firmware. The LED should be lit and steady.
Install USB Driver (Windows Only)
Windows needs a special driver in order to have OpenOCD communicate with the picoprobe firmware. Most flavors of Linux and macOS come with the driver installed by default.
Download and run Zadig.
Select Options > List All Devices. Select Picoprobe (Interface 2) from the drop-down menu. The driver will likely be listed as (NONE). Select libusb-win32 as the new driver. Click Install Driver.
When it’s done, the current driver should appear as libusb0.
Configure VS Code
Now that we have everything built, we can configure VS Code to give us step-through debugging.
Open VS Code. If it does not open to your blink project, select File > Open Folder. Click on your blink folder (the one we created in the previous tutorial), and click Select Folder.
Click on the Extensions button on the left side of VS Code. Search for cortex. Click to install the Cortex-Debug extension.
I also highly recommend searching for and installing the C/C++ extension, which gives us things like code completion, function peeking, etc.
Click the Explorer button on the left side of VS Code. Create a new folder named .vscode in your blink project folder. This folder will hold some files unique to our project and tell VS Code where to find the necessary debugging tools (e.g. OpenOCD).
Create a new file named launch.json in the .vscode folder. Enter the following text into launch.json:
{
    "version": "0.2.0",
    "configurations": [
        {
            "name": "Pico Debug",
            "cwd": "${workspaceRoot}",
            "executable": "${command:cmake.launchTargetPath}",
            "request": "launch",
            "type": "cortex-debug",
            "servertype": "openocd",
            // This may need to be arm-none-eabi-gdb depending on your system
            "gdbPath" : "arm-none-eabi-gdb",
            "device": "RP2040",
            "configFiles": [
                "interface/picoprobe.cfg",
                "target/rp2040.cfg"
            ],
            "svdFile": "${env:PICO_SDK_PATH}/src/rp2040/hardware_regs/rp2040.svd",
            "runToMain": true,
            // Work around for stopping at main on restart
            "postRestartCommands": [
                "break main",
                "continue"
            ],
            "searchDir": ["<PATH TO TCL>"],
        }
    ]
}
Change the searchDir value to the location of the tcl folder in wherever you built the Pico version of OpenOCD.
Save this file.
Create another file named settings.json in the .vscode folder. Enter the following text into settings.json:
{
    // These settings tweaks to the cmake plugin will ensure
    // that you debug using cortex-debug instead of trying to launch
    // a Pico binary on the host
    "cmake.statusbar.advanced": {
        "debug": {
            "visibility": "hidden"
        },
        "launch": {
            "visibility": "hidden"
        },
        "build": {
            "visibility": "default"
        },
        "buildTarget": {
            "visibility": "hidden"
        }
    },
    "cmake.buildBeforeRun": true,
    "C_Cpp.default.configurationProvider": "ms-vscode.cmake-tools",
    "cortex-debug.openocdPath": "<PATH TO OPENOCD.EXE>"
}
Change the cortex-debug.openocdPath value to the location of the OpenOCD executable in wherever you built the Pico version of OpenOCD.
Save this file.
Note that by pointing these two files to the location of the Pico version of OpenOCD, we can avoid having to install OpenOCD globally in our operating system.
Start Debugging
We need to make one change to our code. Specifically, we want to disable USB serial and enable UART serial. Open CMakeLists.txt and change the last two lines to the following:
pico_enable_stdio_usb(${PROJECT_NAME} 0)
pico_enable_stdio_uart(${PROJECT_NAME} 1)
Save this file. If you have CMake Tools installed (like we did in the last tutorial), cmake should automatically run. If not, you will need to run it manually from the command line.
Click the Build button (or run “make” manually from the terminal). Click the Run and Debug button on the left side of VS Code.
Click the Start Debugging button (green “play” icon) next to Pico Debug at the top-left of VS Code. Select the blink target from the drop-down list when prompted.
This will build the project again, upload the .elf binary to the target Pico, and start the debugging interface. The status bar at the bottom should turn orange, and some control buttons should appear at the top of VS Code.
You can use the debugging buttons to run code normally, step through lines, go into a function, run and return from a function, reset, and stop debugging. Note that you can also set breakpoints by clicking the red circle to the left of the line numbers. If you run code normally, it will execute until it reaches a breakpoint.
You should be able to watch the target Pico’s LED turn on and off as you step through the code.
You should also be able to use a serial terminal program to connect to the picoprobe (baud rate 115200). Any printf() statements that you put in your program should now come through the picoprobe (over the target’s UART port).
Going Further
I hope this guide has helped you get started debugging your Pico with VS Code. If you would like to dive deeper into the Pico C/C++ SDK, I recommend checking out the following documentation:
Recommended Reading


