Building an Arduino-Based Spectrum Analyzer - The Software
2021-07-07 | By Maker.io Staff
License: General Public License Arduino
The first article in this series explains how to interface the MAX7219 display controllers using an ATMega328PU microcontroller. The second part discusses how to collect audio samples using the MCU’s built-in ADC, and it outlines what fast Fourier transforms are and what we use them for in this project. This last part of the series ties up all the loose ends as it discusses how the rest of the project’s firmware calculates the FFT result from the collected samples and displays it on the LED matrix screens.
BOM
Qty./Part/Link
- (3) 8x8 LED Matrix
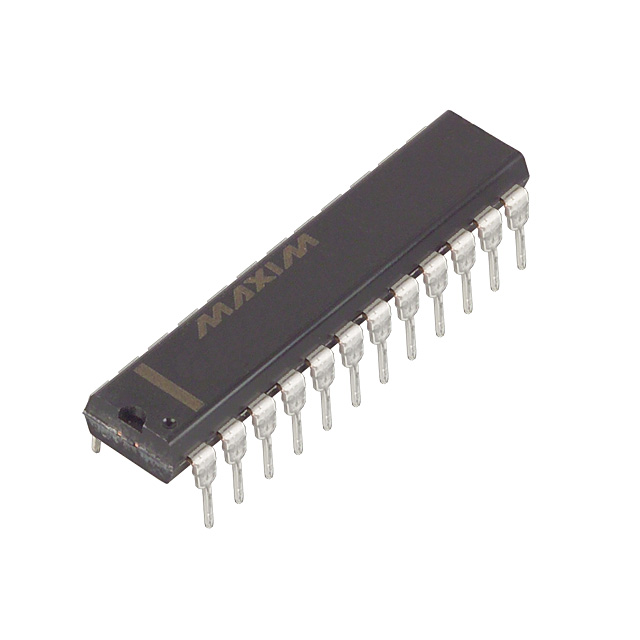
- (3) MAX7219 driver
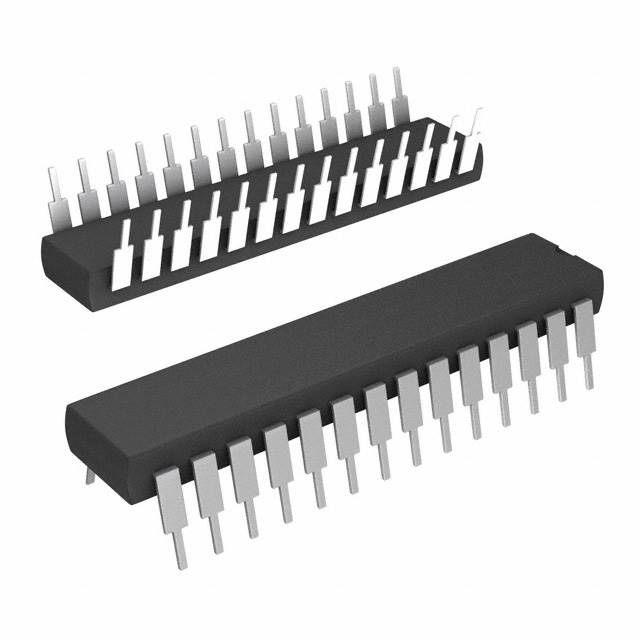
- (1) ATMega 328PU
- (1) IC Socket (24 pin)
- (1) 16 MHz Crystal
- (2) 22pF ceramic capacitor
- (5) 10K resistor
- (3) 6K resistor
- (3) 10uF Electrolytic Capacitor
- (1) 100uF Electrolytic Capacitor
- (2) 1uF Electrolytic Capacitor
- (1) Mini-USB socket
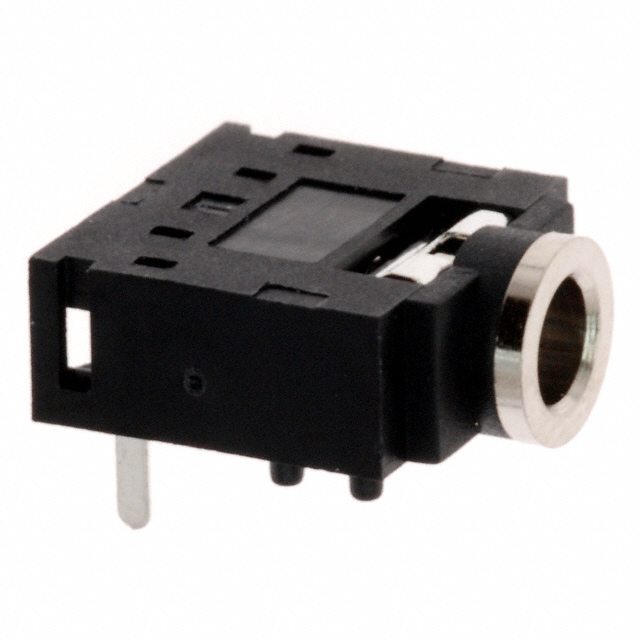
- (1) 3.5mm headphone jack
- (1) Arduino Uno
A Look at the PCB and the Assembly Process
The first part of this series discusses the circuit for this project. There you also had the opportunity to download the Gerber files necessary for ordering custom PCBs using the DigiKey PCB Builder service.
You can mostly follow the standard assembly procedure when you populate the PCB. There are only a few things to look out for when you put together this particular board.
First, you might have already noticed that some components overlap each other on the PCB. I designed it this way to keep the PCB small, which reduces the manufacturing cost. Make sure to solder in the components on the underside first. The bottom side is the one that contains all the ICs. If you put the LED matrix displays in first, the screens will obscure the solder pads of the other components. Then, use an IC socket for the ATMega328PU (IC4) if possible. Doing so will allow you to update the software on the MCU.
The last important thing to remember is not to solder in the MCU just yet. You’ll first have to upload the firmware code to the microcontroller using an Arduino Uno, for example, before you can place the IC on the board. Note that you can also use optional female pin headers instead of soldering in the displays directly. This way, you can swap out the screens if you want to use other colors later:
The Firmware
I’ve already discussed some parts of the firmware in the last article, so I’ll omit them in the following code listings (You can download the complete source code at the end of this article):
/* Include and define statements omitted */

double reals[NUM_FFT_SAMPLES];
double imags[NUM_FFT_SAMPLES];
int oldValues[TOTAL_DISP_COLS];
int bars[TOTAL_DISP_COLS];

int collectedSamples = 0;
long lastBarsUpdate = 0;

// DATA, CLK, LOAD, NUM_DISPLAYS
LedControl lc = LedControl(DISPLAY_DATA_PIN, DISPLAY_CLK_PIN, DISPLAY_LOAD_PIN, NUM_DISPLAYS);
arduinoFFT fft = arduinoFFT(reals, imags, NUM_FFT_SAMPLES, 38640.0);

/* ADC Interrupt handler omitted */

void setup()
{
  /* ADC Initialization omitted */

  for(int i = 0; i < NUM_DISPLAYS; i++)
	initDisplay(i);
}

void loop()
{
  if(collectedSamples < NUM_FFT_SAMPLES)
	return;

  fft.Windowing(FFT_WIN_TYP_HANN, FFT_FORWARD);
  fft.Compute(FFT_FORWARD);
  fft.ComplexToMagnitude();

  double maxi = getMax(&reals[0], TOTAL_DISP_COLS);
  double mini = getMin(&reals[0], maxi, TOTAL_DISP_COLS);

  for(int x = 0; x < TOTAL_DISP_COLS; x++)
  {
	int disp = (int)(x / NUM_DISP_COLUMNS);
	int index = x;
	int y = 0;

      // Ignore FFT results below the threshold
	if(maxi > THRESHOLD)
           // Normalize the FFT result to be in the range [0,8]
      	y = (reals[index] - mini) * ((double)NUM_DISP_ROWS / maxi);

	updateDisplay(disp, (x % NUM_DISP_COLUMNS), y);
	oldValues[x] = y;
  }

  if(BAR_ANIMATION && (millis() - lastBarsUpdate) > BAR_UPDATE_DELAY)
  {
	updateBars();
	lastBarsUpdate = millis();
  }

  // Re-enable sampling in the ISR
  collectedSamples = 0;
}
The setup() method in the listing above looks pretty empty without the ADC initialization procedure. The only other thing the function does is to iterate over all connected displays to enable them. The initDisplay() method makes three calls to the LedControl library to activate the displays before deleting any previously displayed data.
The loop method first checks whether the ISR has collected a pre-defined number of samples for the FFT operation. Note that this number must be a power of two. By default, the program gathers 64 values, which is a good compromise between processing speed and accuracy. Once the ADC finishes the set number of conversions, the update() method performs the FFT calculations.
Once the FFT library determines the results, the update method calls the getMax and getMin functions to find the largest and smallest array element that holds FFT results. Once the update method finds the two extreme values, it enters a loop that iterates over all columns of the LED matrix display. In that loop, the function checks whether the largest value is greater than a predetermined threshold value. This check prevents the spectrum analyzer from displaying noise patterns when there’s no music playing. If the maximum is larger than the threshold, the function calculates the new value of the current column.
Remember that this program samples a signal with a maximum frequency of roughly 20 kHz, and the ISR collects 64 samples, which means that each bin of the FFT result represents a range of 20.000/64 Hz, which is approximately 312 Hertz per bin. The first bin represents the influence of signals between zero and 312 Hz, the second bin contains the result for 313 to 624 Hertz, and so on.
Note that the for loop iterates over all display columns, so the program ignores the remaining FFT results. After a lot of testing, I found that this method yields the most interesting visual result, while it is not an entirely accurate representation of the whole audible spectrum. Once the function determined the new value for the current column, it calls the updateDisplay() method, which takes care of updating values on the screens:
void updateDisplay(int disp, int x, int y)
{
  // Get the column's old value from the array
  double old = oldValues[(disp * NUM_DISP_COLUMNS) + x];

  int d = NUM_DISPLAYS - disp - 1;

  // The supplied column didn't change
  if(old == y)
	return;

  if(old < y)
  {
	for(int led = old; led < y; led++)
  	lc.setLed(d, led, NUM_DISP_COLUMNS - x - 1, true);
  }
  else
  {
	for(int led = old; led >= y; led--)
  	lc.setLed(d, led, NUM_DISP_COLUMNS - x - 1, false);
  }
}
The updateDisplay() routine uses the previously displayed value to determine how to update the current column. If the previous value was larger than the new value, the function needs to turn off some LEDs in that column. Otherwise, it needs to turn additional LEDs on. I decided to update the screens this way because iterating over all LEDs in a column each time the display needs to be updated would produce too much overhead. This way, the MCU only has to update the state of those LEDs that changed.
Note that the displays are in reverse order on the PCBs if the connectors face left. Therefore, according to the MAX7219 chips, the leftmost screen on the PCB is the last one in the cascade. To find the correct address, we need to subtract disp from the total number of displays. Further, we need to decrease the result by one because array indices start at zero.
Last, the update() method contains a call to the updateBars() function, which produces an animation that displays bars at the peaks of each column. Those bars then slowly fall as soon as the display value of that column decreases:
void updateBars(void)
{
  for(int i = 0; i < TOTAL_DISP_COLS; i++)
  {
	int disp = NUM_DISPLAYS - (i / NUM_DISP_COLUMNS) - 1;
	int x = (i % NUM_DISP_COLUMNS);

	if(oldValues[i] < bars[i])
	{
  	// Turn the current bar off
  	lc.setLed(disp, bars[i], (NUM_DISP_COLUMNS - x - 1), false);

  	// Decrease the bar counter for that column
  	bars[i] = bars[i] - 1;

  	// Turn the new bar on (if the level is still above 0)
  	if(bars[i] >= 0)
    	lc.setLed(disp, bars[i], (NUM_DISP_COLUMNS - x - 1), true);
	}
	else
	{
  	bars[i] = oldValues[i];

  	if(bars[i] == 0)
    	lc.setLed(disp, bars[i], (NUM_DISP_COLUMNS - x - 1), false);
	}
  }
}
With each call, the displayBars() method iterates over all columns of the display. Within the for loop, the program decreases the value of an array at the current position. This array stores the current bar positions on the screen. Then, the method deactivates the LED that represents the old bar, and it turns the next LED on if the new bar value is still greater than zero. This animation adds another layer of visual interest, and it creates a more appealing visual effect for the quiet parts of a song:
Testing the Frequency Response of the Finished Product
The ZIP archive, which contains the Gerber files for this project, also includes an audio file you can use to verify the correct operation of the finished product. That mp3 file consists of four sine waves with frequencies ranging from 1KHz to 10kHz. When you play that audio file and feed it into the spectrum analyzer, you should see something similar to this:
The spectrum analyzer correctly detects, separates, and displays the test tones. Note that this is a combined image of the five separate test tone measurements.
As you can see, the spectrum analyzer correctly displays the five prominent frequencies one after another. Then, towards the end of the test, the audio file contains a sweep over the same frequency range. You should see a single line move across the display from left to right. Note that a bit of bleed-through is usual, but you should still be able to make out the dominant frequency.
Remember that one column of the display represents a relatively large range of frequencies. The first few columns on the left represent values ranging from 0Hz to 2kHz and will light up most of the time, which is normal.
This audio test shows that the spectrum analyzer reacts to different frequencies, and it also separates and displays them correctly. Unfortunately, the sample size is limited, which leads to imprecise results. You could improve the project by adding more displays, which would allow the program to display the entire spectrum.
Download the complete spectrum analyzer firmware source code
Summary
The firmware of the Arduino-based Spectrum analyzer directly modifies the ADC registers to set the conversion parameters. The converter then automatically calls an ISR (interrupt service routine) when it finishes an operation. The ISR collects 64 audio samples and stores them in an array. Once that array is filled, the loop() method uses an external Arduino library to perform the FFT calculations. The firmware then normalizes and reorders the results before displaying the outcome on the 28-column LED matrix display. This implementation omits all additional FFT, but there are numerous other ways to handle the remaining values. Besides that, the firmware also contains a routine that updates and displays a simple animation, which creates a visually appealing effect when there’s a quiet section in the audio input.

Have questions or comments? Continue the conversation on TechForum, DigiKey's online community and technical resource.
Visit TechForum








 中国
中国