Understanding and Using Total Error Band in Sensor Selection
投稿人:电子产品
2012-09-27
What true error parameters can you count on when selecting a sensor? In a recent meeting with AJ Smith, director of global product marketing for Honeywell Sensing and Control, we discussed the realities and the myths regarding total error band. Just a few years ago, when Honeywell announced its TruStability product line, it decided to put an end to the confusion and difficulties customers experienced regarding error information by publishing total error band figures for all of its new platforms. Since then, many companies have jumped on the bandwagon and the industry is gaining the ability to select sensors based on a more accurate view of how they will act within specific designs.
What is it?
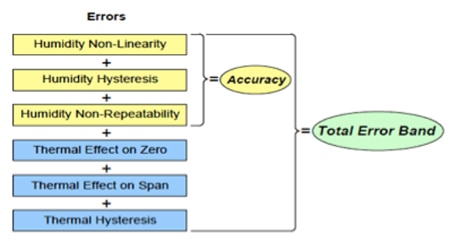
Total error band (TEB) is a figure used by designers to determine how a specific sensor is going to perform within their systems. The figure is compiled by determining the combination of all possible errors for a sensing device within the range of measurements and operating temperatures. By providing TEB information, customers benefit in several ways. Most important of these is the fact that design engineers now have the security of knowing that all possibilities have been considered (Figure 1), so that they don’t have to worry (or at least worry less) about what is being left out. TEB data eliminates individual testing and calibrating of every sensor, which can increase manufacturing and process time. Also critical over the long term, it provides sensor interchangeability by removing part-to-part variation in accuracy. As a result of these benefits, TEB information yields the confidence to move forward with a particular sensor based on real data.

Let’s now look at another example, in this case the TEB of a heavy-duty pressure transducer. Figure 2 indicates the elements used to come up with the final TEB figure. Note that for both the humidity sensor in Figure 1 and the pressure transducer in Figure 2 total error band does not mean accuracy. Accuracy is only one aspect of the TEB. According to Honeywell, “Although manufacturers may specify accuracy of a device, the specification may exclude hysteresis and temperature effects, or be calculated over a very narrow range — at only one point in the range, or at a specific and best accuracy level — causing customers to calibrate the device to ensure it has the accuracy required for a specific application.”

Looking at Figure 2, the TEB is calculated to be the difference between the maximum negative and positive true pressure figures, itself calculated by combining all known errors for pressure sensing. Maximum uncertainty errors for linearity, hysteresis, and repeatability comprise the accuracy figure. Offset, full scale span, and thermal effects within an operating temperature range are also included.
According to Smith, “Honeywell wanted to take its precision, durability and repeatability to the next level to make it easier for our customers to do business. With our next-generation platforms beginning with TruStability products in the July 2009 timeframe, we published a total error band (TEB) number. Our AirFlow, Humidicon and heavy-duty pressure transducers followed suit as well.”
Smith cautions however that although many manufacturers now specify TEB, others, he claims, pepper error figures throughout their datasheets. When this happens, TEB is not really total and the exercise of determining all of the potential errors for a given design rests on the shoulders of the design engineer. The engineer would then need to perform a statistical analysis on their own and make assumptions so that when creating their system they understand the total amount of error that the sensor may have.
TEB for different sensors
Let’s look at examples of total error band across three different sensor types: humidity, airflow, and pressure.
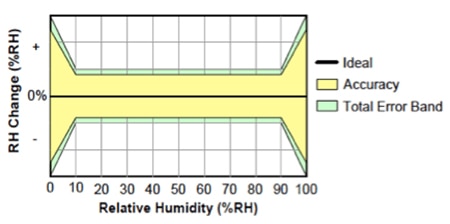
Honeywell’s HIH-6130, 6131 Humidicon Digital Humidity Temperature sensors are digital output-type relative humidity and temperature sensors combined in the same package. The TEB figure of ±5 percent RH represents a measurement that provides the sensor’s true accuracy of ±5 percent RH over a compensated range of 5° to 50°C and 10 percent RH to 90 percent RH (Figure 3). TEB includes all errors due to:
- Humidity nonlinearity
- Humidity hysteresis
- Humidity non-repeatability
- Thermal effect on zero
- Thermal effect on span
- Thermal hysteresis

Honeywell’s Zephyr Analog or Digital Airflow Sensors such as its AWM42300V feature a total error band as low as ±2.25 percent FSS. They provide an analog or digital interface for reading airflow over the specified full-scale flow span and temperature range. Thermally isolated heater and temperature sensing elements help provide a fast response to air or gas flow. The low total error band defines the sensor as appropriate for applications with high accuracy requirements. The device detects presence or absence of airflow from ±50 SCCM to ±750 SCCM, increasing the options for integrating the sensor into the application; it also has high sensitivity at very low flows. Full calibration and temperature compensation typically allow the customer to remove additional components associated with signal conditioning from the PCB, reducing PCB size as well as costs often associated with those components such as acquisition, inventory, assembly).
Examining the elements of total error band components more closely, we find that high stability reduces errors due to thermal effects and null shift to provide accurate readings over time, often eliminating need for system calibration following PCB mount and periodically after that. Low-pressure drop typically improves patient comfort in medical applications, and reduces noise and system wear on other components such as motors and pumps. Linear output provides a more intuitive sensor signal than the raw output of basic airflow sensors, which can help reduce production costs, design, and implementation time.
Our last example is one member of the platform to first incorporate TEB figures, the TruStability HSC Series of Silicon Pressure Sensors. Honeywell’s HSCMRNN001BGAA5 features a low ±1 percent total error band. Here, TEB provides the sensor’s true accuracy over a compensated temperature range of 0° to 50°C [32° to 122°F].
Supporting system accuracy and warranty requirements, the HSC Series of piezoresistive silicon pressure sensors offers an analog output for reading pressure over the specified full scale pressure span and temperature range. Honeywell Sensing and Control’s sensors measure absolute, differential, and gage pressures. The absolute versions have an internal vacuum reference and an output value proportional to absolute pressure. Differential versions allow application of pressure to either side of the sensing diaphragm. Gage versions are referenced to atmospheric pressure and provide an output proportional to pressure variations from atmosphere.
免责声明:各个作者和/或论坛参与者在本网站发表的观点、看法和意见不代表 DigiKey 的观点、看法和意见,也不代表 DigiKey 官方政策。


