Range Measurements in an Open Field Environment
投稿人:DigiKey
2011-08-08
Calculating a link budget involves quantifying numerous variables, but achieving it in practice is considerably more complicated. In this article the author examines the various factors that go into the Friis equation and then takes to the field to check out his results.
Range is one of the most important parameters of any radio system. Data-rate, output power, receiver sensitivity, antennas, and the intended operation environment all influence the practical range of the radio link.
An open field is one of the simplest and most commonly used environments to do RF range tests. However, there are important effects to consider, and failing to address these often results in the test results being misinterpreted. This article addresses non-ideal effects to consider when doing open field range measurements.
In this article, open field refers to a large open area without any interfering radio sources, e.g., a soccer field. At the end of this article, we put our theory to the test in just such a field.
Path loss and propagation theory
Communication is achieved through the transmission of signal energy from one location to another. The received signal energy must be sufficient to distinguish the wanted signal from the always present noise. This relationship is described as the required signal-to-noise ratio (SNR). The necessary SNR for a radio link is sometimes specified in receiver datasheets. More commonly, the sensitivity is specified. This is the absolute signal level (S). When sensitivity is used, one assumes that only thermal noise is present and that the device is operated at room temperature. This section addresses the theory used to determine the range for radio systems in open and free space environments.
The Friis transmission equation
Given two antennas, range in radio communication is generally described by Friis transmission equation (see Equation 1).

Equation 1
- PR: Power available from receiving antenna
- PT: Power supplied to the transmitting antenna
- GR: Gain in receiving antenna
- GT: Gain in transmitting antenna
- λ: Wavelength, where λ = c/f, c = speed of light, and f = frequency
- d: Distance between two antennas
- c: Speed of light in vacuum 299.972458•106 [m/s]
This equation describes the dependency between distance, frequency (wavelength), antenna gain, and power.

Example 1: Using the Friis equation.
In free space, the path loss is 80.2 dB over a 100 m distance when operating at 2.445 MHz.
In more down to earth applications, higher attenuation is expected. An open field is the simplest of these environments.
Link budget
The Friis equation is often referred to as the link budget. The difference between the received signal power, PR, and the sensitivity of the receiver is referred to as the link margin. In a realistic link budget, additional loss has to be added to the losses predicted by the Friis equation. This article addresses some of these losses in an open field environment. Range is the distance at which the link is operating with a signal level equal to the receiver sensitivity level. In digital radio systems sensitivity is often defined as the input signal level where PER (Packet Error Rate) exceeds one percent.
Ground reflection (2-ray) model
In a typical radio link, transmission waves are reflected and obstructed by all objects illuminated by the transmitter antenna. Calculating range in this realistic environment is a complex task requiring huge computing recourses. Many environments include mobile objects, adding to the complexity of the problem.
Most range measurements are performed in large open spaces without any obstructions, moving objects, or interfering radio sources. This is primarily done to get consistent measurements.
The Friis equation requires free space to be valid. Handheld equipment generally operates close to the ground. This implies that ground influence has to be considered to do valid range calculations.
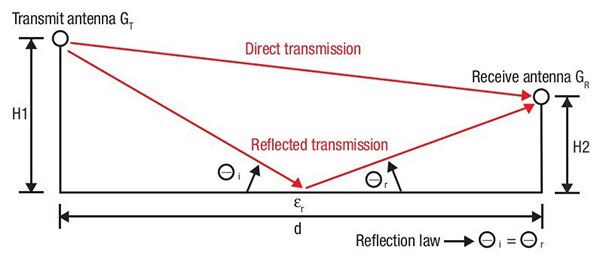
Figure 1 illustrates the situation with an infinite, perfectly flat ground plane and no objects obstructing the signal. The total energy received can then be modeled as the vector sum of the direct transmitted wave and one ground reflected wave.
The two waves are added constructively or destructively depending on their phase difference at the receiver. The magnitude and phase of the direct transmitted wave varies with the distance traveled. The magnitude of the reflected wave depends on the total traveled distance and the reflection coefficient (Γ) relating to the wave before and after reflection.
 Figure 1: Transmission with ground.
Reflection coefficient
Whenever an incident radio signal hits a junction between different dielectric media, a portion of the energy is reflected, while the remaining energy is passed through the junction. The portion reflected depends upon the signal polarization, the incident angle, and the different dielectrics (εr, μr and σ). Assuming that both substances have equal permeability, μr = 1, and that one dielectric is free space, Equation 2 and 3 are the Fresnel reflection coefficients for the vertical and horizontal polarized signals.

Equation 2

Equation 3
The equations require some electrical data for the soil in the test environment. Barton and Leonov [Ref. 1, pg. 394] present a table showing εr and σ for some typical soil conditions. εr =18 and σ = 0 are used for all of the calculations reported here.
In systems where H1 and H2 are low compared to d, Equation 2 and 3 can be simplified to ΓV=Γh=-1. For example, in systems with low incident angle, all of the energy is reflected. The phase change of the reflected wave is significant to the transmission budget, as illustrated in Figure 2.
 Figure 2: Difference in transmission loss due to polarization.
Figure 2 shows the influence of polarization and the ground in open field measurements. The values are calculated using the Matlab function described later in this article. The figure indicates a large difference between the Friis Transmission Equation for free space and the expected performance when ground influence is included. The figure also indicates that the horizontal polarization (H) is more susceptible to multipath fading than the vertical polarized signal (V). Over long distances, the signal level including the ground is considerably lower than predicted by the Friis Equation. Finally, observe that the vertically polarized signals have higher energy at long distance, when compared to the horizontally polarized signals.
Note: In many applications, there are strong cross-polarized components, making it difficult to separate the polarizations. The actual signal level is then often between the vertical and horizontal levels calculated above.
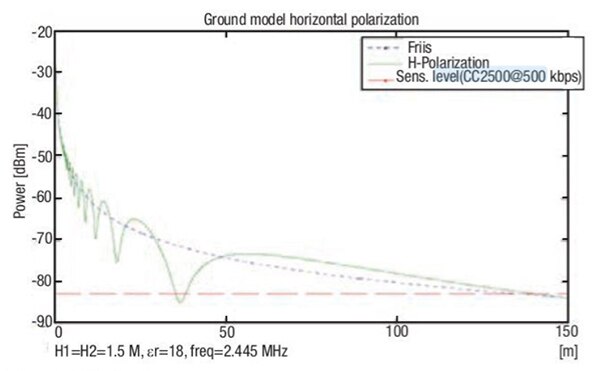
 Figure 3: Multipath fading.
Figure 3 shows calculated values for a 2445 MHz horizontally polarized signal. The Friis Equation for free space and the 500 kBaud sensitivity level are included in the figure for comparison. If one wanted to measure the effective open field range for the CC2500 at this data rate, they typically would start the EB PER test and begin to increase the distance between the two radio units. The figure indicates that communication would be lost at about 35 m. Clearly, the range potential is far greater. To identify this unused potential, the two units have to be separated further than 39 m to regain communication.
The location of this blind spot will vary with frequency, ground electrical characteristics, and antenna elevation. It is important to be aware of this during measurement to identify if you have reached a local blind spot or the final range of the equipment.
The difference between the level predicted by the Friis equation and the receiver sensitivity is often denoted as a fade margin.
Noise
Noise is another important parameter when considering range.
Noise can be categorized by its source. Thermal noise is noise generated by all objects due to its molecular thermal activities. Other radio traffic may be considered another form of noise.
The noise from other electrical equipment is inherently difficult to describe in mathematic/statistical models. Equation 4 describes thermal noise.

Equation 4
Temperature, effective noise bandwidth, and impedance determine the total thermal noise.
At room temperature (300 K, 27°C) this equation is often approximated by -174 dBm + 10Iog10(B), describing the situation with a perfect load match.
Example:
CC2500 with 500 kBaud and BW = 812.5 kHz (recommended values) gives a room temperature noise floor at -174 dBm + 59.1 dBm = -114.9 dBm. The sensitivity is specified to be -83 dBm, resulting in an SNR of 31.9 dB. An SNR of 31.9 dB is more than the demodulator requires, clearly indicating the potential range extension using an external LNA (CC2500 has a simulated typical noise figure of about 16 dB).
Thermal noise is not a problem during range measurements. It should be verified that the area used is free from other noise sources on the same frequency band. This could be done using a spectrum-analyzer (maximum hold) to look for noise sources prior to performing the test. This check could preferably be repeated at regular intervals during the test. Selecting a test area with low probability of interference is generally recommended. A photograph of the test area used in my model validation tests can be seen at the end of this article.
Do the math
Friis equation for free space
| % friis_equation(Gt,Gr,f,n,d); % This function is based on the theory in Application report SWRA046A % This function calculates the propagation loss. % path_loss_indoor = Gt·Gr·(C/(4·pi·f))^2·(1/d)^n % Gt: Gain in transmitter antenna [dB] % Gr: Gain in receiving antenna [dB] % f: Carrier frequency [Hz] % d: distance in meter [m] % n: path loss exponent (See table below) |
||
| % Location | n | std. deviation |
| % Freespace | 2.0 | |
| %Retail store | 2.2 | 8.7 |
| %Grocery store | 1.8 | 5.7 |
| Office, hard partitions | 3.0 | 7.0 |
| Office, soft partitions | 2.6 | 14.1 |
| Metalworking factory, line of sight | 1.6 | 5.8 |
| Metalworking factory, obstructed line of sight | 3.3 | 6.8 |
% Constants:
% c = 299.972458e6; Speed of light in vacuum [m/s]
function out=friis_equation(Gt,Gr,f,n,d);
c = 299.972458e6; % Speed of light in vacuum [m/s]
out = (Gt + Gr + 20*log10(c/(4* pi*f)) - n*10*log 10(d)); % Loss in [dB]
Friis equation with ground reflection
Copy
% friis_equation_with_ground_presence(h1,h2,d,freq,er,pol)
% This function calculate the loss of a radio link with ground presence
% h1: Transmitting antenna elevation above ground.
% h2: Receiving antenna elevation above ground.
% d: Distance between the two antennas (projected onto ground plane)
% er: Relative permittivity of ground.
% pol: Polarization of signal ‘H'=horizontal, ‘V'=vertical
% freq: Signal frequency in Hz
% Transmitting and receiving antenna assumed ideal isotropic G=0dB
% **********************************************************************

function retvar=friis_equation_with_ground_presence(h1,h2,d,freq,er,pol)
c=299.972458e6; % Speed of light in vaccum [m/s]
Gr=1; % Antenna Gain receiving antenna.
Gt=1; % Antenna Gain transmitting antenna.
Pt=1e-3; % Energy to the transmitting antenna [Watt]
lambda=c/freq; % m
phi=atan((h1+h2)./d); % phi incident angle to ground.
direct_wave=sqrt(abs(h1-h2)^2+d.^2); % Distance, traveled direct wave
refl_wave=sqrt(d.^2+(h1+h2)^2); % Distance, traveled reflected wave
if (pol=='H') % horizontal polarization reflection coefficient
     gamma=(sin(phi)-sqrt(er-cos(phi).^2))./
     (sin(phi)+sqrt(er-cos(phi).^2));
else
     if (pol=='V')% vertical polarization reflection coefficient
          gamma=(er.*sin(phi)-sqrt(er-cos(phi).^2))./
          (er.*sin(phi)+sqrt(ercos(phi).^2));
     else
          error([pol,' is not an valid polarization']);
     end %if
end %if
length_diff=refl_wave-direct_wave;
cos_phase_diff=cos(length_diff.*2*pi/lambda).*sign(gamma);
Direct_energy=Pt*Gt*Gr*lambda^2./((4*pi*direct_wave).^2);
reflected_energy=Pt*Gt*Gr*lambda^2./((4*pi*refl_wave).^2).*abs(gamma);
Total_received_energy=Direct_energy+cos_phase_diff.*reflected_energy;
Total_received_energy_dBm=10*log10(Total_received_energy*1e3);
retvar=Total_received_energy_dBm;
%end function
Validating the ground reflection model
 Figure 4: Signal strengths at the 7 cm, 31 cm and 115 cm elevation levels.
Figure 4 shows a comparison between the CC2500 operated in a SmartRFO4EB and the Matlab ground reflection model.
The measurements were performed on a football/soccer field.
Dots are measurements and lines represent calculated values.
A fixed correction level was added to the calculated values to get an overall better match to the measured values. This correction value represents the difference between the ideal isotropic antenna and the efficiency of the CC2500EM and SmartRF Studio EB. The plotted values are the values measured.
The measured signal energy was higher for the horizontal polarized signal. This is explained by the directivity of a horizontal-oriented, quarter wave antenna. When the same antenna is vertically oriented, the energy is radiated in all directions, hence reducing effective gain in the direction of the receiver.
The open test field
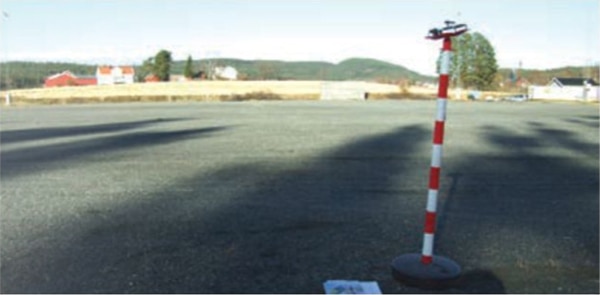
A rural environment significantly reduces the probability of 2.4 GHz interference. The following photo shows the test area where the Matlab ground model was validated.
Note that the EB was mounted on a plastic pole to minimize its influence on the measurement results.
The iron light towers showed no real influence on measurements. They were sufficiently far away to allow the direct and ground reflected signals to be the only significant contributors to the total received power.
The body had significant influence on the measurement. The measurement at each distance point was performed in my absence. This made the measurements extremely time consuming.

Summary
This article addressed the influence of the ground during range measurements.
It was shown that multipath fading can generate confusion during measurements if you are unaware of the phenomenon. Ground presence was shown to generate more rapid signal degradation than predicted by Friis equation for free space. Ground reduces the effective range.
Vertical polarization was shown to be less susceptible to ground reflection fading and range degradation than horizontal polarization. For handheld equipment, polarization is generally not controllable and this observation has minor importance.
Finally, it has been emphasized that other radio traffic influences range measurements, and should be controlled or monitored throughout the measurements. (Did you remember to turn off your mobile Bluetooth® during measurement?) Coexistence with other equipment is generally not implemented in test software for range measurements.
References
- Radar Technology Encyclopedia, David K. Barton, Sergey A. Leonov 1997 Artech House Inc Boston/London, ISBN 0-89006-893-3

免责声明:各个作者和/或论坛参与者在本网站发表的观点、看法和意见不代表 DigiKey 的观点、看法和意见,也不代表 DigiKey 官方政策。


