Energy Debugging Tools for Embedded Applications
投稿人:Convergence Promotions LLC
2011-01-11
As the development process moves forward, the code gets larger, and optimizing for energy efficiency becomes a hard and time-consuming task. Without proper tools, identifying errors, such as avoidable wait cycles that could be replaced by interrupt service routines, or peripheral misusage, becomes increasingly difficult. If these "energy bugs" are not spotted and solved during the development stage, it is virtually impossible to detect them in field or burn-in tests.
There is an ever-growing number of embedded systems applications where energy saving and efficiency are at the top of developers' priorities. These constraints can be due to government regulations (e.g. metering applications), a requirement to increase battery life, or simply a need to lower the electricity bill. In battery-operated systems, energy efficiency often plays the most important role. In cases where developers are satisfied with their systems' battery lives, increasing the energy efficiency means they can switch to smaller and cheaper batteries which lowers the overall costs. There are also situations where the operating life must be extended to the maximum; for example, where the battery cannot be replaced or replacement involves very high costs.
To accommodate this trend, a growing number of "ultra-low-power" microcontrollers (MCUs) have become available. However, tools that provide developers with a detailed monitor of their systems' energy consumption have not accompanied the MCUs until recently. Having a low-power MCU by itself does not mean lower energy consumption. The trick is to optimize your software, not just in terms of functionality, but also with respect to energy efficiency. Having full control of the hardware surrounding the MCU and optimizing the overall software and peripheral usage are crucial factors for reducing system energy consumption. Software is not usually seen as an energy drain but every clock cycle consumes energy. Minimizing this is a key challenge in reducing overall system energy consumption.
Developers are now able to visualize the energy consumption of their systems and relate it to the software running on the microcontroller. Real-time information on current consumption is correlated with program counter sampling to provide advanced energy monitoring capabilities.
Energy friendly embedded systems development can be seen as a three stage cycle: hardware debugging, software functionality debugging, and software energy debugging.
The challenge of energy friendly software development
The major concerns when developing MCU software are typically related to reducing memory usage and having the smallest possible code size. But for applications with a tight energy budget there are other software dependent factors that enter into the equation.
To achieve energy friendliness, aiming to spend the longest time in sleep mode is a very typical scenario, but it is not the only way to save energy. Energy efficient MCUs are often packed with other functions that enable even lower energy consumption. In addition to the sleep modes available on these MCUs, efficient use of their functions is the real secret for energy sensitive applications.
As the development process moves forward, the code gets larger and optimizing for energy efficiency becomes a hard and time-consuming task. Without proper tools, identifying errors, such as avoidable wait cycles that could be replaced by interrupt service routines, or peripheral misusage, becomes increasingly difficult. If these "energy bugs" are not spotted and solved during the development stage it is virtually impossible to detect them in field or burn-in tests.
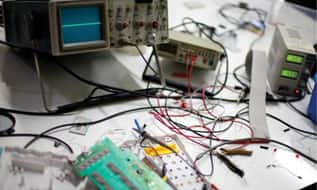
Figure 1: Old-fashioned energy debugging.
The most common way to track how much energy a system draws is by sampling the current over a certain period followed by averaging and extrapolation to longer time periods. This kind of measurement can be done using a multimeter or oscilloscope, but it is not possible to relate the results to code routines. On the other hand, a logic analyzer can be used to keep track of the routines but cannot relate that to the energy consumption. For battery life estimation purposes, the results obtained with extrapolation should not be too far away from a real-case usage scenario, but when the goal is optimizing the code for energy efficiency there is not, until now, been any way to relate code with energy consumption using development tools.
Solution
Energy Micro addresses the energy debugging problem with software and hardware tools that display graphical real-time energy consumption information and allow correlation between current and the actual code running at any given moment.
The AEM (Advanced Energy Monitoring) system is part of Energy Micro's kits (EFM32 Gecko Starter Kits (STK) and Development Kits (DVK)). Real-time information about current consumption can be viewed on an onboard LCD display (if using the DVK) or can also be displayed by the energyAware Profiler by connecting any of the kits to a computer through a USB port.
While the stand alone AEM on the DVK allows developers to keep track of their applications' current consumption, more features are available when using the AEM (both on STK and DVK) together with the Profiler to achieve advanced energy debugging.
Energy debugging is now a circular development cycle where developers can use Energy Micro's hardware and software tools together with EFM32 MCUs to achieve the lowest energy consumption in their applications (Figure 2). The developer can iteratively debug the code towards energy friendliness with instant feedback on the applied changes.
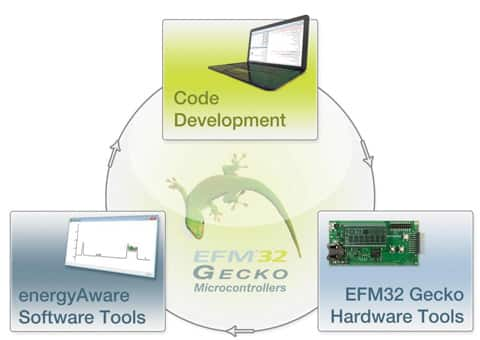
Figure 2: New energy debugging cycle.
Advanced Energy Monitoring (AEM)
The AEM is built into both the STK and DVK, enabling the developer to track a system's energy consumption while the application is running and therefore with real (not estimated) current values. As these currents are measured, other components can also be included, to give a complete view of the systems energy consumption.
The LCD display is located on the lower left side of the DVK and the information is represented on a current versus time graph together with other information such as MCU power supply voltage (Figure 3). Energy consumption is simply the area below the current trace, so the smaller the area the smaller the energy drain. This is achieved by reducing the current consumption and the time the MCU takes to execute tasks. It is therefore easy to realize how important the time factor is for energy debugging. Instant power consumption is not the same as energy consumption and a low-power microcontroller might not be a low energy microcontroller. Reducing the time spent in active mode by executing tasks faster will save energy, even though the current consumption in active and sleep modes remain the same. If an MCU uses half the power compared with another MCU, but takes 10x the time for a calculation, the energy consumption for that MCU will be larger. For simple applications the AEM+LCD solution might be a powerful enough tool to help developers optimize their systems for energy friendliness.
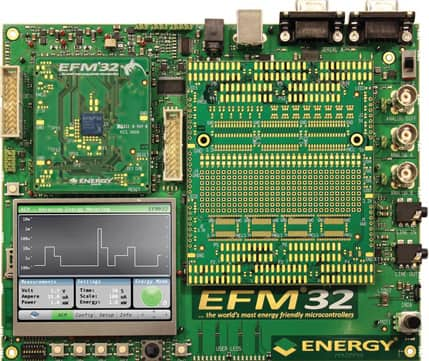
Figure 3: Development kit.
The dynamic range of the onboard AEM goes from a minimum of 100 nA to a maximum of 50 mA (more than 110 dB). This covers the needs of most energy sensitive applications and it is important to notice that it measures not only the current drawn by the MCU but also the current drawn by other system components, as long as they are supplied from the power rail monitored by the AEM.
The AEM uses a current sensor that samples the current flowing through the VMCU power rail. On a timer tick, it samples and converts the current then outputs it through USB. Voltage and timing information are sent together with the current value.
The bandwidth of the AEM is 60Hz when measuring currents below 200 µA and 120 Hz when measuring currents above 200 µA. On the DVK it is possible to control the VMCU level and in order for the AEM to work properly it should not be lower than 3.3V. From an accuracy perspective, when measuring currents above 200 µA the maximum error is 0.1 mA and below 200 µA the accuracy increases to 1 µA.
Nevertheless, in this range the AEM is able to detect changes in current consumption as small as 100 nA. The EFM32 can be set to output program counter samples through the Serial Wire Viewer Output (SWO) pin which is sent together with the AEM data (current, voltage, and time) (Figure 4). Enabling this feature increases power consumption slightly which should be accounted for when debugging the device.
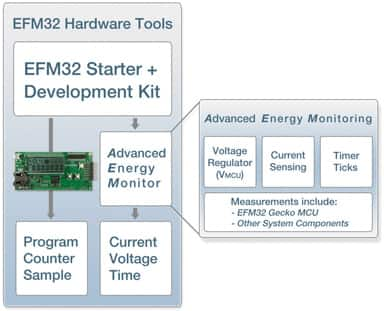
Figure 4: Hardware Tools overview.
energyAware Profiler
The energyAware Profiler is an advanced energy debugging tool that complements the DVK and STK. This software tool gets data from the AEM on the kits via USB and displays information in a current vs. time graphical representation.
The final result of code compilation is an object file (*.out) that follows the ELF (Executable and Linkable Format) file standard and contains DWARF (Debug with Arbitrary Record Format) debug information (Figure 5). This file must be loaded into the Profiler so that the code trace feature works properly.
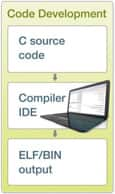
Figure 5: Code development overview.
The program counter samples sent from the EFM32 are correlated with the object file using libelf and libdwarf to find the source file, function, and C code line running on the MCU. That information is then correlated with the AEM data so that it can be placed on the correct timing. It is then displayed together with time and current consumption (Figure 6).

Figure 6: Profiler functional overview.
Besides displaying current consumption over time the Profiler is packed with features for advanced energy debugging. The same way as on the DVK's LCD, the current consumption is displayed by default on a logarithmic scale, but this can be changed to a linear representation for greater detail.
There are three main windows in the software, the code listing window, current graph, and function listing (Figure 7). By clicking on any point over the current graph, a part of the code in the code listing window will be highlighted. This corresponds to the actual piece of code running at that given moment and with that given level of current consumption. The function listing provides the total energy that each function consumes and the percentage of total energy consumption for which it accounts.
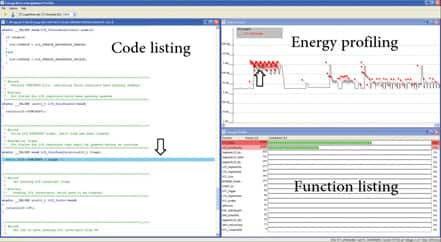
Figure 7: energyAware Profiler.
When clicking on the current graph more data is displayed on the lower right corner of the Profiler window (Figure 8). This data tells the user which function is running, the last PC sample, current, voltage and at what point in time the code was executed. Average current can also be calculated, by marking the wanted part of the current graph.

Figure 8: Information on selected point.
It is also possible to enable IRQ (interrupt requests) pinpointing. This will show a listing of the different IRQs labeled with different colors for easier identification. If the user wants to analyze the profiling information later in time, it is possible to export the data to a file and then import it for deeper analysis when required.
Energy debugging example
This short example demonstrates how to use the energy profiling tools together with features from the EFM32 microcontroller to decrease energy consumption and increase battery life in the widest range of applications. In this example the LEUART module will be used, which enables UART communication to a baud rate of up to 9600 while keeping energy consumption to a minimum.
A common way of getting data from the reception buffer is to poll it until we get valid data and then perform a buffer reading. By doing this the processor must be in a run mode which results in a relatively high current consumption.
The profile for such a loop is a constant current consumption of 3.33 mA (Figure 9). By clicking on the graph the function causing the drain is highlighted.
void pollLEUARTRx(void)


{


while ( !( LEUART0 -> STATUS & LEUART_STATUS_RXDATAV ) );


} 
Figure 9: LEUART RX polling.
The highlighted code line is the polling loop which checks if the buffer has received any valid data. The profiler also shows each function and how much each contributes to total energy consumption. In this case the only function in the code is pollLEUARTRx(), which naturally accounts for 100 percent of the energy consumption (Figure 10).

Figure 10: Function energy consumption.
A common workaround to avoid polling of the RX buffer is to enable RX interrupts and set the MCU in sleep mode. If we enable the LEUART RX interrupt and put the EFM32 in Sleep Mode (shut off the CPU) it is easy to see that the energy savings are significant.
As we shut off the processor, the current dropped to 1.40 mA (Figure 11). Now when the LEUART receives a frame of bytes it will wake up and transmit the data back through the TX buffer.
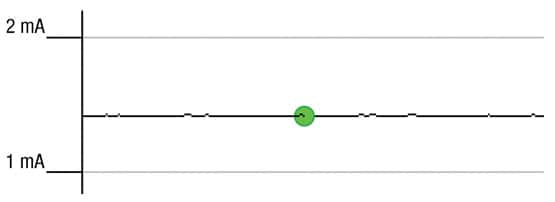
Figure 11: Sleep Mode.
When the interrupt is triggered the current spikes to around 2.5 mA and the profiler pinpoints the interrupt routines (Figure 12). However the current stays on this peak for a long time and by clicking on the graph it is possible to detect another common mistake when using UART communication.
void pollLEUARTTx(void)


{


while( !( LEUART0 -> STATUS & LEUART_STATUS_TXC) );


} 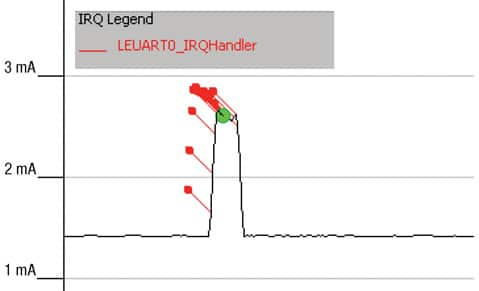
Figure 12: LEUART RX Interrupt with LEUART TX polling.
After sending the data the user sets a while loop waiting for the transmission to finish. This will of course keep the processor in running mode longer than necessary. The loop can be replaced by an interrupt that wakes up the processor once the transmission is finished. By doing this the current consumption will again be reduced (Figure 13).
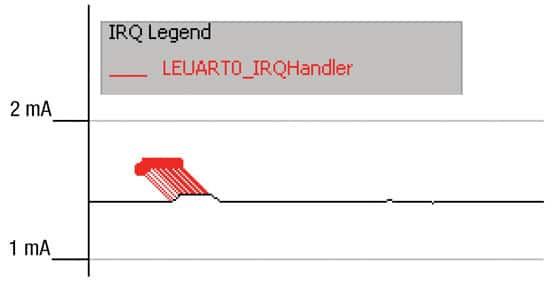
Figure 13: EFM32 in Sleep Mode between received bytes.
Now the processor goes into Sleep Mode between each frame byte thus lowering the average current consumption. The byte transmission is done without processor intervention so it is not necessary to poll the buffer to know when the transmission is finished. Replacing the loop with an interrupt routine is a much more elegant and energy friendly solution as has been shown with the different profiles of the two approaches.
The LEUART module on the EFM32 MCUs can be functional in a Deep Sleep Mode. In this mode the high frequency oscillators are shut down, but low frequency oscillators (RC or crystal) are still running and clocking the LEUART. If we repeat the above example but now putting the EFM32 in Deep Sleep Mode the energy consumption drops to µA levels.
To be able to visualize these current numbers the profiler scale had to be switched from linear to logarithmic. The current is now 1 µA in Deep Sleep Mode and spikes to 80 µA when receiving the frame (Figure 14).
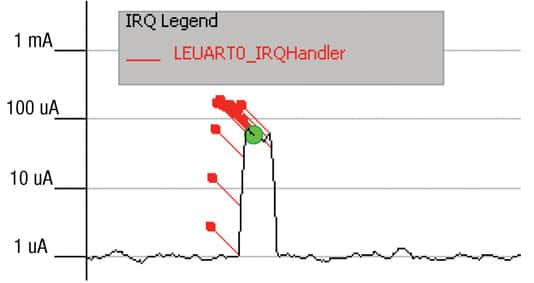
Figure 14: EFM32 in Deep Sleep Mode.
The enhancement in energy saving from the first approach to this final configuration is a factor of over 1000. The energyAware Profiler together with EFM32's unique features enabled fast and powerful energy debugging on this very simple case scenario.
Conclusion
The world of energy debugging before Energy Micro was expensive, complicated, and time consuming resulting in a longer development cycle (Figure 1). Too much equipment and effort were required to achieve poor and inaccurate results. The energy footprint of a product was not known until the end of the design cycle, making it harder to optimize for energy consumption. The end result could be to install an oversized battery to withstand the high energy demands of the application.
These energy pitfalls can now be avoided with Energy Micro's patent pending toolset for advanced energy debugging. The simple and affordable solution presented by Energy Micro enables developers to identify and remove energy bugs with a high degree of accuracy. Energy debugging can be carried out throughout the entire development stage with iterative improvements clearly visible to the developer. This will reduce the development time to meet the energy requirements for each individual application. Together with the unique energy saving features of the EFM32, these tools now pave the way for the world's most energy friendly applications.

免责声明:各个作者和/或论坛参与者在本网站发表的观点、看法和意见不代表 DigiKey 的观点、看法和意见,也不代表 DigiKey 官方政策。


