Developing Energy Budgets for Low-Power Sensing Systems - Part II: The Art of the Power Budget
投稿人:电子产品
2012-02-29
Developing an energy budget that insures a product will achieve its target service life can be a bit of a “black art,” but there are a few relatively simple techniques that can help an engineer achieve the right balance of performance and power consumption. Part I of this series provided a run-down of the system elements typically found in a low-power wireless node and looked at the capacities and characteristics of the most commonly-used energy harvesting and battery elements. This second installment will provide a simple methodology for developing a first-order energy budget that can be used to make sure the intended energy harvesting system or battery is properly-sized to the design. This will be followed by a few strategies for fine-tuning a design to extend service life or accommodate the limitations of available power sources.
Define your requirements
Both the system and its energy budget begin with a thorough definition of its intended mission, the activities it will perform, and the desired service lifetime (Figure 1). Some important parameters to consider include:
- Service Environment – What is the system's service life and operating temperature range?
- Sampling Modes/Sampling Rates– What analog and digital inputs should the design monitor, and how frequently? Which inputs are sampled on a scheduled basis and which ones are triggered by outside stimulus?
- How much data is collected and how much local processing is applied to the data?
- Does the system communicate with other nodes or a host node? If so, is it via wired or wireless link?
- How often does the system communicate, and how much data is exchanged in the process?
From these requirements, the engineer can develop a preliminary design using a low-power MCU and any additional LDOs, RTC/timers, I/O or communication circuitry the application requires.
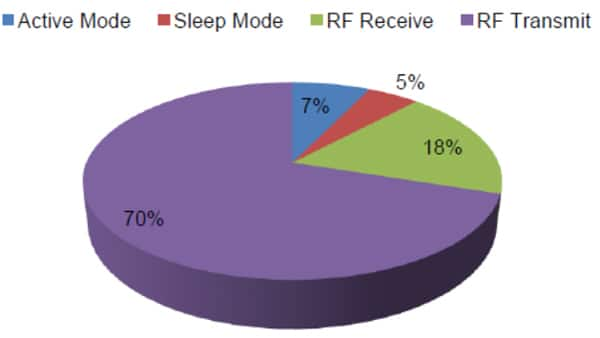
Figure 1: Identifying the relative power consumption of an embedded system’s various operating modes is an essential part of developing and managing its energy budget (Courtesy of Silicon Labs).
As an example, we will use a relatively simple data logging sensor based on Microchip Technologies’ 16-bit PIC16LF1826 MCU (Figure 2). The system specification requires it to take a sample every 100 ms. After the MCU acquires 32 samples in its RAM, the data is written to an external EEPROM. The system waits 50 s between sample groups and takes 5 ms to store the collected data.
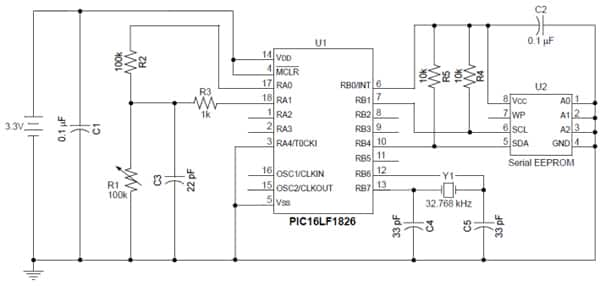
Figure 2: Schematic of a simple data acquisition system based on the PIC16 MCU (Courtesy of Microchip Technologies).
Define your power states
To measure the system’s maximum dynamic power, use an oscilloscope to monitor the voltage across a shunt resistor (typically 10-100 Ω) placed in series with the power supply. The system can be brought to an active state using a simple program that exercises the I/O, memory, and other peripherals that it will be using during the most active phase of its operation. If this is unavailable, a relatively accurate estimate can be determined by adding up the operating current ratings listed on each component’s data sheet, plus any significant loads imposed by termination circuitry or capacitive loading.
Understanding the system’s maximum dynamic current is especially important if it will be powered using a high-impedance battery (such as a coin cell) or an energy harvesting power source (which often stores its power in a thin-film battery). This is because if the system’s maximum current is too high, it will result in excessive losses within the power source. In many cases, it is possible to reduce the system clock speed, transceiver data rate or sequentially activate and deactivate various functional blocks to keep peak current within the power source’s limits.
The system’s static current consumption must also be defined. Because it is typically in the ranges of tens or hundreds of nA, actual measurement can be difficult but a useful estimate can be made from idle current specifications in the data sheets of the processor and any other elements (typically external RTCs, LDOs, and sensor electronics), which will remain active while the system is in its “deep sleep” mode.
Build a power profile
A system power profile provides a structure to look at the energy required to support each of the system’s operational states (including Sleep/Standby) and how much time they spend in each state. It allows a designer to select a baseline power source and to focus his optimization efforts on the system’s largest “energy sinks.” This fairly straightforward procedure involves listing the operational states/modes of a design, along with the power consumption, and relative duration of each mode. For example, the operational modes of the system in Figure 2 are characterized in the table below (Figure 3). The example shown here does not have a data transceiver so it has only a few modes (i.e., Sleep, Initialize, Read Sensors, Process Data, Store Data, etc.). Additional modes can be incorporated into the profile if an additional I/O element, wired or wireless transceiver were added in future upgrades.
Regardless of how many modes it has, the power profile table is created by:
- Listing the individual system elements required to support each state/mode, the power consumption of each element and relative amount of time it spends in that state over a given period. If a working prototype is available the power level can be derived empirically. If hardware is unavailable, it can be estimated from component data sheets and system operational requirements; and
- Calculating the total energy consumed in each state/mode by multiplying its operating power by the time it spends in that mode.
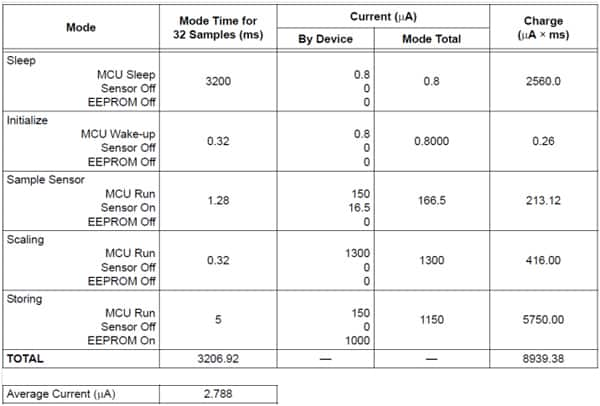
Figure 3: System power profile table (Courtesy of Microchip Technologies).
The system power profile’s data makes it easy to calculate the system’s average current for its Active Mode. This is calculated by taking the total of Charge consumed during each operating mode, that is (3200 ms x 0.8 µA) + (0.32 ms x 0.8 µA) + 1.28 ms x 166.5 µA) and dividing it by the sum of its Mode Times (3206.6 ms) for an average current of 2.788 µA. The system power profile also clearly identifies the scaling operation as the Mode with the peak current of 1.3 mA (Figure 4).
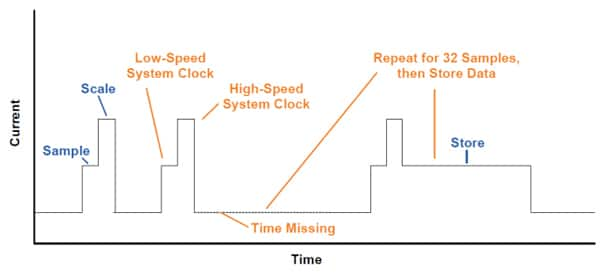
Figure 4: Visual representation of the application’s Power Profile (Courtesy of Microchip Technologies).
Caveats
As useful as this technique can be, it’s important to understand that it calculates an application’s average current with the assumption that its waking activity follows a fairly predictable pattern that’s primarily determined by prompts from its RTC, on-board timers, or other regularly-occurring events. If an application’s wake time and activities are heavily affected by non-deterministic external stimulus, such as motion sensors, analog comparator outputs, or interaction with other sensor network elements, it may be advisable to develop a power profile based on a usage scenario that drives the system with much more activity than would be expected in a typical application. In most cases, this will still mean that the MCU will spend 99.9 percent or more of its time in a sleep or low-power standby mode.
It should also be noted that this simplified method does not factor in “Wake-Up Time,” the period during which the MCU is drawing power as it returns from sleep mode but its clock oscillator is not yet stable enough to permit execution of instructions (Figure 5). Depending on the particular MCU and which sleep mode is used, this can range between 50 ns and 1 ms and can account for an appreciable fraction of a power budget in systems with short active periods. However, this is usually only of concern if the system’s Wake-Up Time is more than 1/10-1/20 the length of its active period.
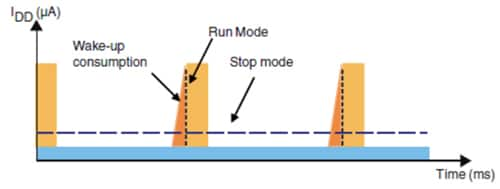
Figure 5: During its Wake-Up period, an MCU consumes power while waiting for its clock oscillator to stabilize sufficiently to permit execution of program code (Courtesy of STMicroelectronics).
Energy source considerations
The first-order model constructed will allow an engineer to compare the system’s average current consumption against the energy available from a particular energy harvesting or battery power source. Keep in mind that battery size constraints in energy harvesting systems necessitate creativity and innovation in order to maximize efficiency of the power source (see the TechZone article “Optimal Power Management Techniques in Energy Harvesting Designs”).
Depending on their desired service life and power requirements, most battery systems an engineer may be planning to replace with an energy harvesting solution use standard alkaline or lithium cells, available in several standard form factors/capacities (Figure 6).
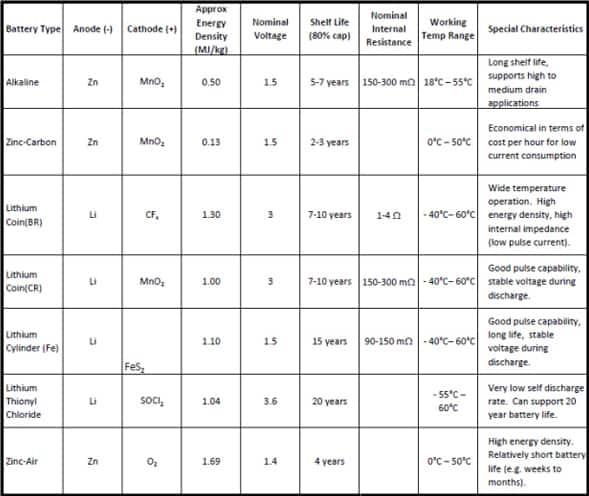
Figure 6 : Characteristics of common battery chemistries.
The actual amount of power a battery can actually deliver depends on many factors, including operating temperature and how quickly it is discharged. Since low-power embedded systems have relatively low current requirements, it is usually safe to assume that most, or all of the battery’s theoretical capacity is available. This is typically 2500-2900 mAh for alkaline AA cells like the Energizer 3-315 and 1000-1200 mAh for AAA cells like the Energizer 3-3121.
Lithium-based cells have slightly higher capacities and significantly longer lives (up to 15 years) and a broader temperature range. Lithium coin cells deliver anywhere from 30 mAh (CR1025) to 600+ mAh (CR2450) and an Energizer L92 AAA cell delivers 1200 mAh.
The Average Available Current (IA) can be calculated using the equation:
IA = (Total Capacity - Margin)/Total Hours (Service Years x 365x24)
Note - If the system is operating in a moderate temperature range (typically between 0 and 25 degrees Celsius) the Margin factor in the equation = 0. For operation in warmer environments, the battery’s capacity should be de-rated according to the manufacturer’s data.
For example, if a CR2450 lithium coin cell is supposed to provide a 12-year service life, it can support an average load of up to 630 (12x365x24)mA (5.99 µA). In comparison, a typical lithium AA cell has a 15-year shelf life and can support an average load of 23.78 µA.
Identify and tune major power sinks
The power profile you constructed can now be used to identify opportunities to reduce the system’s power consumption to extend its service life. Since a typical remote sensing node spends the vast majority of time in its Standby/Seep modes, it’s often a good place to start the optimization process by employing strategies such as:
- Whenever feasible, use a Sleep/Standby mode that enables use of on-chip hardware that performs autonomous data collection and storage without having to wake the MCU. But if data collection cycles are infrequent, it may still save more energy to put the system into a full power-down mode between readings.
- For some processors, such as Energy Micro’s Gecko series and the Silicon Labs C8051F91x family, it’s worthwhile to look at the trade-offs between a standby state that leaves the MCU’s RAM contents intact and a lower-power sleep state. Often, the energy consumed by the RAM-friendly sleep mode is lower than energy required to restore memory from a cold start.
An engineer’s power profile should also uncover one or more aspects of active mode operation, which can be power-optimized. Some of the most common tactics for active mode energy management include:
- Carefully considering the system clock speed’s effect on power consumption. In general, running an MCU at a faster speed saves energy by allowing it to execute code quickly and spend more time in Sleep/Standby mode.
- Being careful since any power savings can be lost if the MCU must frequently spend time waiting for other system elements (I/O, A/D converters, memory, etc.) to complete its tasks. This is especially true of operations that involve accessing non-volatile memory (especially serial EEPROMs). The latencies of these devices’ read/write cycles can easily keep the MCU awake much longer than the engineer or the system’s batteries would like.
- For these “long tent pole” operations, look for other operations that can run concurrently and, where possible, use dedicated peripherals to perform functions when the CPU is occupied.
- Since radio systems are usually even more power-hungry than the CPU (typically on the order of 10 to 20 mA for the Rx function and even more for Tx), it’s often best to use the fastest data rate that can be reliably supported by the system’s link budget. Be careful, however, to stay within the limited current capabilities of many energy harvesting sources and some batteries.
Summary
This article can only serve as an introduction to the art and science of energy budgets. To learn more, the references supplied below are a great place to start. There are also several other TechZone articles that provide more tips on fine-tuning sleep mode energy consumption including; “Snooze Mode Dramatically Reduces Power Consumption in 16-bit MCUs” and “Advanced Sleep-Mode Techniques for Enhanced Battery Life in Real-Time Environments”
References
- Microchip Application Note AN01416a – "A Low-Power Design Guide"
- Microchip application Note AN1267 – "nanoWatt & nanoWatt XLP Technologies: An Introduction to Microchip's Low Power devices".
- Silicon labs White Paper – "Selecting the Optimal Battery for your Embedded Application"
- STMicroelectronics – Technical Article #TA0342 – "Accurate power consumption estimation for low power MCUs"
免责声明:各个作者和/或论坛参与者在本网站发表的观点、看法和意见不代表 DigiKey 的观点、看法和意见,也不代表 DigiKey 官方政策。


 中国
中国