Air Flow Measurement in Electronic Systems
投稿人:DigiKey
2015-05-13
Electronic circuit boards create some of the most complex and highly three dimensional fluid flows in both air and liquid. The combination of open channel (clearance to the next card above the components) and large protrusions (components, e.g., BGAs, PQFBs, etc.) creates varied pressure distributions that contribute to such flow complexities. These distributions include highly three-dimensional flows with all modes of fluid flow structures (laminar, turbulent, pulsating, unsteady, etc.) and significant flow reversals (Figure 1).
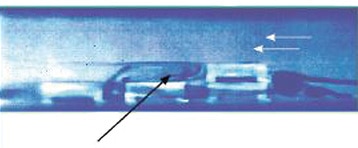
Figure 1: Visualization of water flow over an electronic board. The first component is twice the size of the others down-stream.
Figure 2 shows a Direct Numerical Simulation (DNS) of a PCB with straight and disked fin heatsinks. Note the complex flow structure with premature egress of the flow from the fin field in both types of heatsinks.
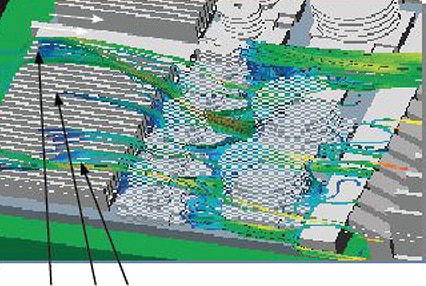
Figure 2: Computational Fluid Dynamics (CFD) simulation of a PCB with straight and disked fin heatsinks.
The complexity and unpredictability of these flows present problems when one needs to determine the temperature rise in a channel or a device’s junction temperature. Because most analysis tools fail to accurately predict such complex flows, direct measurements are often needed.
The role of fluid velocity
Fluid velocity has a significant role in maintaining or determining a component’s junction temperature.
Figure 3 shows the value of Rja as a function of the air velocity for a typical component.
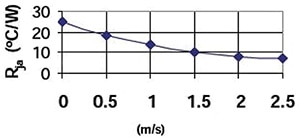
Figure 3: Junction-to-ambient thermal resistance as a function of air velocity.
Let’s take a simple and first order approach, i.e., junction-to-ambient thermal resistance, as shown in Figure 3,

where Ta is the approach air temperature obtained from the change of enthalpy across the board, upstream of the component.
![]()
Where Q is the power dissipated on the board, upstream of the component of interest, Tamb is the temperature of free ambient, and ṁ is the mass flow rate defined by the following:
![]()
Where ρ is the air density, V is air velocity, and A is the cross-sectional area of the channel. CP is the specific heat at constant pressure.
Substituting equations 2 and 3 into 1 and solving for Tj,
![]()
Considering that the junction temperature, Tj, is the most important parameter in electronics cooling, Equation 4 clearly shows the role that fluid velocity plays in the magnitude of Tj.
Measuring Fluid Velocity
There are numerous techniques for measuring fluid flow (liquid or gas).¹ The following methods are the most suitable for use in electronic systems:
- Hot-film and hot-wire anemometry (most common) measure fluid temperature based on heat transfer.
- Pitot tube velocimetry (not accurate for low flows). This method uses Bernoulli’s equation to relate the pressure difference to the velocity
- Laser Doppler velocimetry (LDV). This technique measures the speed of micron-sized seeding particles that flow through a pair of focused laser beams. Optical access to measurement area and seeding of the flow are required.
- Particle image velocimetry (PIV). Requires optical access and seeding of the flow. It is basically LDV in a plane.
LDV and PIV, though accurate, require line of sight to the measurement area and do not measure air temperature. They are not commonly used in electronics systems, although they are effective tools in a wind tunnel setting.
Hot-wire anemometry (HWA)
From the methods listed above, hot-wire anemometry (HWA) is by far the most suitable method for electronics cooling applications. Hot-wire anemometers are heat transfer elements. By maintaining the wire or bead temperature at a constant level (150-250ºC), one can correlate the rate of heat required to maintain the wire temperature constant to that of the air velocity passing across the sensor. Thus, to accurately measure the velocity, one must know the temperature of the air approaching the sensor, where the velocity sensor is, and the sensor temperature itself.
The governing equation for HWA is given by Equation 5,
![]()
Where Q is the power to the sensor supplied by the HWA electronics, Asensor is the surface area of the sensor, Tsensor and Tapproach are the Sensor and the Approach air temperatures, respectively, and, α and ß are deduced from the calibration of the HWA. Two points are noteworthy:
- The Tapproach plays a pivotal role in the magnitude of the velocity reported by the sensor. Therefore, in non-isothermal flows, it is imperative that the air temperature is measured at the same location as the velocity sensor.
- α and ß are calibration dependent. If the HWA is not calibrated properly, the data reported by the system will be erroneous.
There are two sensor types in the market: single and dual. With the single type, the same sensor measures both air temperature and velocity at the same location. In the dual type, two independent sensors are used for temperature and velocity measurements, and are placed apart from each other, as shown in Figures 4 and 5.
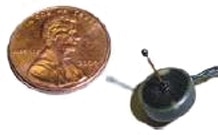
Figure 4: Single-sensor technology. (Product of Advanced Thermal Solutions, Inc.)
![]()
Figure 5: Dual-sensor technology.
These technologies have some unique advantages. Yet, both also have design disadvantages that may affect measurement results. In single-sensor technology, there is a brief lag time between the temperature and velocity measurements during which the temperature might slightly change. While this difference, if any, is typically miniscule, the results are not based on perfectly simultaneous measurements.
There are four key possible sources of error in dual-sensor technology:
- Fluid temperature gradient
- Radiation heat transfer between the velocity and the temperature sensors
- Lack of calibration at elevated temperatures
- Sensor size and its support body
1 – Fluid temperature gradient
Dual sensors measure temperature and velocity at two different points. This can cause significant errors if the air flow is non-isothermal – which is the case with the air flow over most PCBs. Using Equation 5, the table below shows the magnitude of such errors:
| Velocity (m/s) | Fluid TempTa(°C) | Error in velocity (%) |
| 1 | 30 | 0 |
| 1.21 | 35 | 21 |
| 1.35 | 38 | 35 |
| 1.45 | 40 | 45 |
| 2.1 | 50 | 110 |
Table 1: Induced errors resulting from non-isothermal flow in a PCB channel.
2 – Effect of radiation heat transfer
Dual sensors feature the hot (velocity) and cold (temperature) elements working in close proximity. Radiation coupling between them causes the temperature sensor to report a Tapproach that is substantially larger than the actual. As a result, the measurement system will produce significant errors in air velocity magnitude.
| Actual temperature | Reported by thermocouple (TTC) |
| 17.4 | 20 |
| 21.4 | 24 |
| 25.4 | 28 |
| 27.4 | 30 |
Table 2: Effects of radiation heat transfer on dual-sensor HWA temperature measuring probe.
By referring to Table 1, one can see what the error in velocity measurement will be as the result of radiation heat transfer to the temperature sensor.
3 – Lack of calibration at elevated temperature
Because a HWA is a heat transfer sensor and is exposed to high temperature air during actual testing, its calibration must include the impact of air temperature at different levels. Without elevated temperature calibration, the results would be riddled with measurement errors. Figure 6 shows the typical calibration surface that is required for elevated temperature testing.
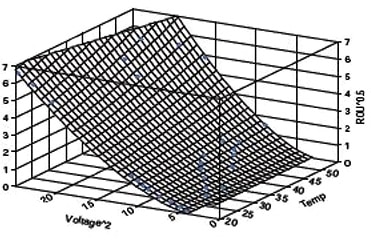
Figure 6: Required calibration surface including the effects of elevated temperatures.
4 – Size of sensor, and its support body
Good measurement practices mandate that the best sensor is the one that introduces the least disturbance in the flow field. As seen in Figure 7, large blocks alter the flow dramatically and cause errors in measurement.
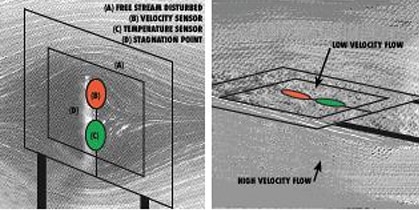
Figure 7: Effect of large sensors in flow dispersion.
The following example shows the magnitude and impact that such sensors have on the final design or operation of a system.
Example – measuring air velocity in telecom equipment
Extreme temperature gradients are commonly observed in typical electronic cabinets. An improperly designed HWA can give false readings when used in these environments. Figures 8a and 8b show temperature and velocity distribution in a telecom cabinet, where:
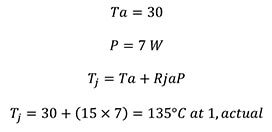
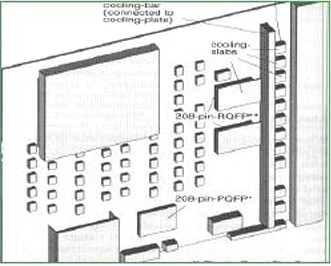
Figure 8a: Typical telecom cabinet. (Philips Kommunications Industrie AG)

Figure 8b: Dual-sensor HWA used to measure Va and Ta for calculating junction temperature.
By using Equation 5 and the data from Figure 8b, had we used a dual sensor, the resulting velocity would have been 1.35 m/s versus 1 m/s. Subsequently, the device junction temperature would have been:
![]()
Considering that the set limit for a typical ASIC, i.e., critical junction temperature, is 125ºC, any temperature at least 10% below the set limit is acceptable. In this application, had the engineer used a properly designed sensor, where the air temperature and velocity were measured at the same point, the resulting junction temperature would have been 135ºC. This is substantially above the critical temperature of 125ºC. Now, the use of a dual air velocity sensor resulted in junction temperature of 107ºC, substantially below the critical temperature, and thus rendering the design acceptable. In reality, the ASIC will be operating at an unacceptable temperature of 135ºC that will adversely impact its electrical operations and reduce its expected life.
Examples like these show that accurate air flow measurement is an essential component of successful product design. Since device temperature impacts system life and is a direct function of air velocity, choosing a properly designed flow sensor will be instrumental in the success of the product in the market place.
This article first appeared in the Qpedia Thermal eNewsletter in September, 2010.
Reference:
- Azar, K., Thermal Measurements in Electronics Cooling, CRS Press, 1997.

免责声明:各个作者和/或论坛参与者在本网站发表的观点、看法和意见不代表 DigiKey 的观点、看法和意见,也不代表 DigiKey 官方政策。


 中国
中国